
Aug 11, 2026
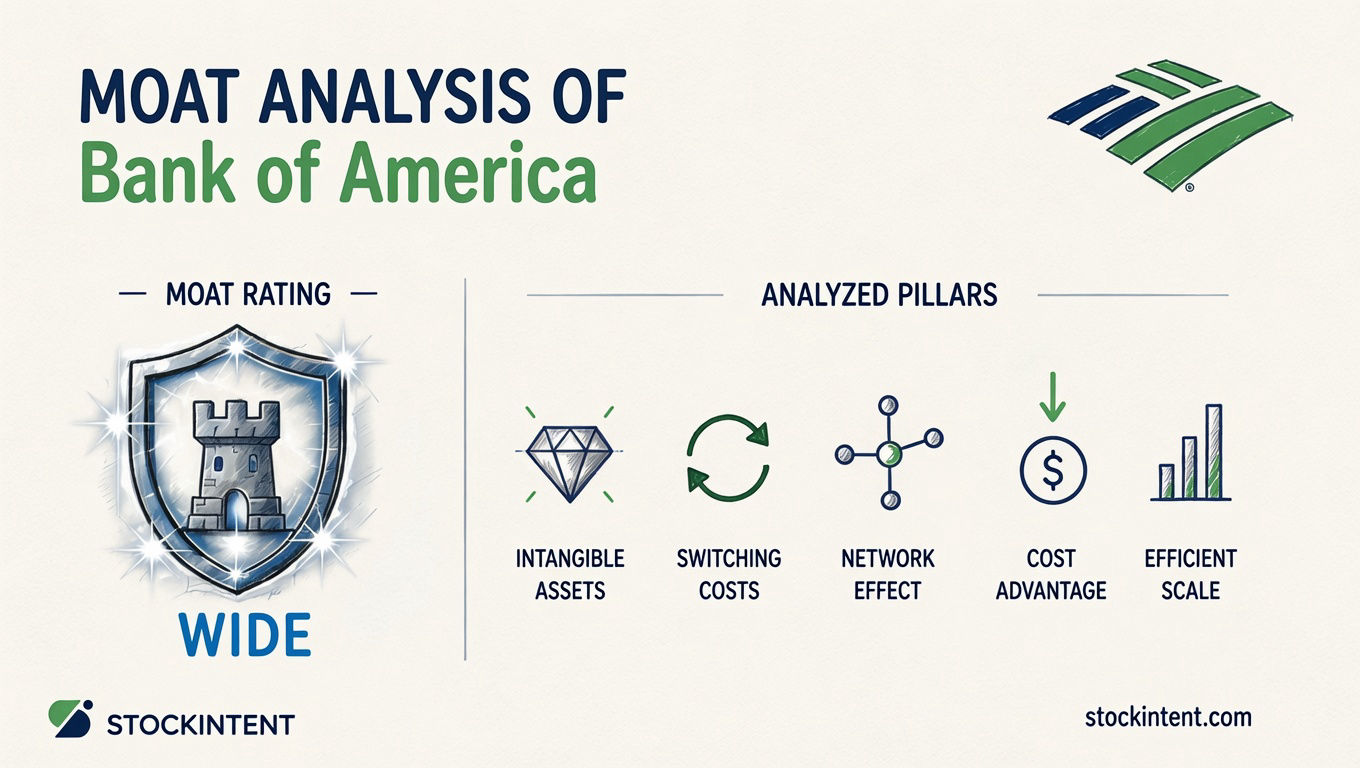
Bank of America carries a Wide economic moat with a Stable to modestly widening trend and Medium uncertainty. That verdict rests on a deposit franchise that competitors struggle to replicate, not on trading windfalls or brand prestige alone.
Here's the distilled view:
A key argument for our assessment is $514.5 billion in non-interest-bearing deposits which essentially represents free funding that few peers can match. Combined with 69 million consumer relationships across 3,650 financial centers, this creates a cost-of-funds advantage that compounds over time.
This analysis evaluates business quality and durability, not whether the stock is a buy today. A wide moat can still produce poor returns if purchased at the wrong price, and a narrow moat can work at the right valuation. Our focus here is the strength of the underlying business model.
Bank of America's moat rests on switching costs and cost advantage far more than on network effects or brand mystique. We assess each of the five pillars below, ranked from strongest to weakest.
Switching Costs: Strong
This is the bank's most durable advantage. 92% of Bank of America consumer checking customers treat it as their primary bank, and the franchise has logged 29 consecutive quarters of net new checking growth. That stickiness isn't loyalty in the abstract. It's direct deposit pipelines, auto-pay relationships, mortgage servicing, and years of accumulated trust that make switching banks genuinely painful. With 69 million consumer clients and 3,650 financial centers, the web of relationships deepens with every additional product a household adopts.
Pro Insight: In our experience analyzing bank moats, switching costs from primary banking relationships prove far more durable than the network effects often cited for fintech disruptors. A 92% checking primacy rate represents years of accumulated trust, direct deposit logistics, and bill-pay relationships that create friction no app can easily displace.
Cost Advantage: Strong
The deposit base is the engine. Bank of America holds $514.5 billion in non-interest-bearing deposits that cost essentially zero, alongside $1.469 trillion in interest-bearing deposits. One analysis cites the bank's consumer deposit costs as the lowest in the industry. That funding edge compounds through rate cycles. When competitors pay more for every dollar they lend, Bank of America's spread economics widen without taking additional credit risk.
Intangible Assets: Moderate to Weak
Brand and trust matter in banking, but they matter differently than in consumer products or technology. Bank of America benefits from being a known, regulated institution that households trust with their savings. What it lacks is proprietary intellectual property, patented technology, or a brand that commands pricing power. The sources acknowledge scale and brand as moat contributors, yet no evidence points to unique IP or protected assets that would make this pillar stand alone.
Efficient Scale: Weak to Moderate
Size helps, but it is not the same as efficient scale in the classic sense. Bank of America is undeniably large, yet U.S. retail banking remains fragmented enough that new entrants and regional competitors can still find profitable niches. The evidence does not demonstrate a market structure where additional competitors are structurally deterred. Scale supports the cost advantage and switching cost pillars, but calling it a separate, decisive moat overstates the case in our opinion.
Network Effects: Weak / Not Material
This pillar simply does not apply. No source provides evidence of a genuine two-sided network effect where additional users directly increase value for other users. One corporate strategy page claims network effects exist, but offers no concrete proof. Traditional banking is not a platform business. Your neighbor using Bank of America does not make your checking account more useful.
When we evaluate these pillars, we use StockIntent's company reports as the workflow for analyzing these moat pillars with detailed financial metrics, rankings against peers, and historical performance data to access each pillar's durability. We look for exactly this kind of evidence hierarchy: which advantages show up in financial metrics? Which rest on marketing language?
Bank of America's competitive advantages aren't theoretical. In Q1 2026, they produced tangible results: revenue grew 7% while expenses rose only 4%, generating positive operating leverage that scale economics make possible. That spread between revenue and cost growth is exactly what you'd expect from a bank with a deep, sticky deposit franchise.
The capital productivity metrics reinforce the story. ROTCE reached 16.0% and ROA hit 0.99% in the quarter, showing the bank earns solid returns without excessive leverage. More telling still, consumer banking and global wealth each posted more than 20% net income growth. Diversified strength across business lines means the franchise doesn't depend on any single revenue source.
But here's where we need to separate real moat from cyclical luck. Equities trading revenue surged 30% to $6.8 billion, which management called the bank's best quarter in 15 years. That's a genuine competitive position in capital markets, yet the timing matters. Q1 strength was explicitly tied to a turbulent geopolitical climate that drove volatility. Trading spikes like this are real earnings, but they're not evidence of the deposit franchise's durability. They can disappear as quickly as they arrive.
The moat shows most clearly where it's boring: healthy consumer spending, improving credit quality, and higher loan and deposit balances. These are the grinding, repeatable advantages of a primary banking relationship. The $9.2 billion returned to shareholders in Q1, split between $5 billion in buybacks and $4.2 billion in dividends, signals excess capital generation from core operations rather than one-time gains.
Bank of America's moat is stable to modestly widening. We don't expect to see a dramatic shift. The core deposit franchise and customer relationships remain intact, but the direction of travel depends on whether management converts regulatory relief and technology investment into sustained efficiency gains, or whether credit headwinds and balance-sheet constraints erode the advantage.
What's pushing the moat wider
Three forces are working in Bank of America's favor. First, softened Basel III Endgame proposals have eased capital pressure, freeing up flexibility for buybacks and investment that smaller competitors cannot match. Regulatory relief rarely creates moats by itself, but it can widen the competitive gap when scale leaders deploy that capital more aggressively than regional banks can afford.
Second, a more normal yield curve is improving net interest margin economics versus the inverted environment that squeezed spreads in prior years. Third, AI and automation investments target genuine efficiency improvements. If execution follows through, lower unit costs and better digital engagement could deepen switching costs while compressing the efficiency ratio.
What's holding it back
The $81 billion bond overhang in unrealized losses is a concrete constraint. If rates rise further or credit weakens, this portfolio becomes a capital drag that limits management flexibility. Commercial real estate and office exposure add similar pressure. These risks are embedded in the balance sheet today.
Trading revenue also muddies the signal. Q1 2026 equities trading surged 30%, and Reuters linked this strength directly to turbulent geopolitical conditions. That volatility is a cyclical exposure that can reverse as quickly as it arrives. We don't expect this to be part of the long-term moat compounding.
What to watch
We track four indicators to judge whether the trend is improving or weakening:
You can organize these metrics into a monitoring system using StockIntent's watchlist feature with custom views to track whether Bank of America's moat is improving or weakening over time.
We rate Bank of America's moat uncertainty as Medium. The core deposit franchise is predictable enough to narrow the range of bad outcomes, but cyclical trading revenue, regulatory shifts, and macro sensitivity keep the upside and downside wider than a true utility-like business.
The most stable piece is net interest income. Management raised full-year 2026 NII growth guidance to 6–8%, up from 5–7%, and tied it to visible balance-sheet drivers: loan growth, deposit stability, and runoff of lower-yielding assets. That kind of repeated guidance increase suggests high confidence in the core revenue engine. When a bank can forecast its largest revenue stream with this specificity, the floor on business outcomes rises.
The volatile piece is trading and capital markets. Q1 2026 equities trading revenue surged 30%, and CNBC explicitly linked this to a turbulent geopolitical climate. Reuters later noted that second-quarter market revenue could exceed 15% growth, again driven by market whiplash rather than structural demand. These are real earnings, but they can reverse as quickly as they appear. That lumpiness widens the range of plausible annual outcomes.
Regulatory uncertainty adds another layer. A proposed 10% credit-card cap and evolving capital rules create policy risk that is hard to model. Even the softened Basel III Endgame, which helps today, could be reconsidered through a full credit cycle. From our experience, regulatory relief rarely creates economic moats, but it can widen the competitive gap between scale leaders and regional banks when capital flexibility enables differentiated buyback capacity and investment spending. The uncertainty lies not in whether Bank of America benefits, but in whether regulators sustain the relief through a full credit cycle.
Consumer macro sensitivity rounds out the picture. Inflation and energy costs still influence spending behavior, loan demand, and credit quality. The bank's 92% checking primacy rate keeps customers from fleeing, but it doesn't make them borrow more or spend more when household budgets tighten.
Putting this together, the plausible range over three to five years is moderately narrow for the core franchise but widened by these cyclical and regulatory factors. Bank of America is unlikely to collapse as a competitive force, yet its earnings trajectory carries enough uncertainty that we'd want to see sustained execution before calling the trend definitively widening.
Bank of America earns a Wide economic moat with a Stable trend and Medium uncertainty. That verdict stands on two pillars that are genuinely hard to replicate: switching costs anchored by a 92% checking primacy rate, and a funding cost advantage built on $514.5 billion in zero-cost deposits.
The two developments that could change this view are straightforward. First, whether AI and automation investments translate into sustained efficiency ratio improvement, or merely become another technology spending cycle without measurable payback. Second, how the $81 billion bond overhang resolves. If rates rise further or credit weakens, those unrealized losses could constrain capital flexibility and force trade-offs between growth investment and shareholder returns.
A wide moat describes business quality, not investment timing. The franchise is durable, the core earnings are predictable, and the competitive position is defensible. What remains uncertain is the path of earnings through rate cycles, regulatory shifts, and credit normalization. Watch the efficiency trajectory, NII growth versus the 6–8% guidance, CRE credit quality, and capital return sustainability to judge whether the moat is widening or holding ground.
This content is for informational and educational purposes only and is not investment advice.
Bank of America carries a Wide economic moat with a Stable to modestly widening trend and Medium uncertainty. That verdict rests on a deposit franchise that competitors struggle to replicate, not on trading windfalls or brand prestige alone.
Here's the distilled view:
A key argument for our assessment is $514.5 billion in non-interest-bearing deposits which essentially represents free funding that few peers can match. Combined with 69 million consumer relationships across 3,650 financial centers, this creates a cost-of-funds advantage that compounds over time.
This analysis evaluates business quality and durability, not whether the stock is a buy today. A wide moat can still produce poor returns if purchased at the wrong price, and a narrow moat can work at the right valuation. Our focus here is the strength of the underlying business model.
Bank of America's moat rests on switching costs and cost advantage far more than on network effects or brand mystique. We assess each of the five pillars below, ranked from strongest to weakest.
Switching Costs: Strong
This is the bank's most durable advantage. 92% of Bank of America consumer checking customers treat it as their primary bank, and the franchise has logged 29 consecutive quarters of net new checking growth. That stickiness isn't loyalty in the abstract. It's direct deposit pipelines, auto-pay relationships, mortgage servicing, and years of accumulated trust that make switching banks genuinely painful. With 69 million consumer clients and 3,650 financial centers, the web of relationships deepens with every additional product a household adopts.
Pro Insight: In our experience analyzing bank moats, switching costs from primary banking relationships prove far more durable than the network effects often cited for fintech disruptors. A 92% checking primacy rate represents years of accumulated trust, direct deposit logistics, and bill-pay relationships that create friction no app can easily displace.
Cost Advantage: Strong
The deposit base is the engine. Bank of America holds $514.5 billion in non-interest-bearing deposits that cost essentially zero, alongside $1.469 trillion in interest-bearing deposits. One analysis cites the bank's consumer deposit costs as the lowest in the industry. That funding edge compounds through rate cycles. When competitors pay more for every dollar they lend, Bank of America's spread economics widen without taking additional credit risk.
Intangible Assets: Moderate to Weak
Brand and trust matter in banking, but they matter differently than in consumer products or technology. Bank of America benefits from being a known, regulated institution that households trust with their savings. What it lacks is proprietary intellectual property, patented technology, or a brand that commands pricing power. The sources acknowledge scale and brand as moat contributors, yet no evidence points to unique IP or protected assets that would make this pillar stand alone.
Efficient Scale: Weak to Moderate
Size helps, but it is not the same as efficient scale in the classic sense. Bank of America is undeniably large, yet U.S. retail banking remains fragmented enough that new entrants and regional competitors can still find profitable niches. The evidence does not demonstrate a market structure where additional competitors are structurally deterred. Scale supports the cost advantage and switching cost pillars, but calling it a separate, decisive moat overstates the case in our opinion.
Network Effects: Weak / Not Material
This pillar simply does not apply. No source provides evidence of a genuine two-sided network effect where additional users directly increase value for other users. One corporate strategy page claims network effects exist, but offers no concrete proof. Traditional banking is not a platform business. Your neighbor using Bank of America does not make your checking account more useful.
When we evaluate these pillars, we use StockIntent's company reports as the workflow for analyzing these moat pillars with detailed financial metrics, rankings against peers, and historical performance data to access each pillar's durability. We look for exactly this kind of evidence hierarchy: which advantages show up in financial metrics? Which rest on marketing language?
Bank of America's competitive advantages aren't theoretical. In Q1 2026, they produced tangible results: revenue grew 7% while expenses rose only 4%, generating positive operating leverage that scale economics make possible. That spread between revenue and cost growth is exactly what you'd expect from a bank with a deep, sticky deposit franchise.
The capital productivity metrics reinforce the story. ROTCE reached 16.0% and ROA hit 0.99% in the quarter, showing the bank earns solid returns without excessive leverage. More telling still, consumer banking and global wealth each posted more than 20% net income growth. Diversified strength across business lines means the franchise doesn't depend on any single revenue source.
But here's where we need to separate real moat from cyclical luck. Equities trading revenue surged 30% to $6.8 billion, which management called the bank's best quarter in 15 years. That's a genuine competitive position in capital markets, yet the timing matters. Q1 strength was explicitly tied to a turbulent geopolitical climate that drove volatility. Trading spikes like this are real earnings, but they're not evidence of the deposit franchise's durability. They can disappear as quickly as they arrive.
The moat shows most clearly where it's boring: healthy consumer spending, improving credit quality, and higher loan and deposit balances. These are the grinding, repeatable advantages of a primary banking relationship. The $9.2 billion returned to shareholders in Q1, split between $5 billion in buybacks and $4.2 billion in dividends, signals excess capital generation from core operations rather than one-time gains.
Bank of America's moat is stable to modestly widening. We don't expect to see a dramatic shift. The core deposit franchise and customer relationships remain intact, but the direction of travel depends on whether management converts regulatory relief and technology investment into sustained efficiency gains, or whether credit headwinds and balance-sheet constraints erode the advantage.
What's pushing the moat wider
Three forces are working in Bank of America's favor. First, softened Basel III Endgame proposals have eased capital pressure, freeing up flexibility for buybacks and investment that smaller competitors cannot match. Regulatory relief rarely creates moats by itself, but it can widen the competitive gap when scale leaders deploy that capital more aggressively than regional banks can afford.
Second, a more normal yield curve is improving net interest margin economics versus the inverted environment that squeezed spreads in prior years. Third, AI and automation investments target genuine efficiency improvements. If execution follows through, lower unit costs and better digital engagement could deepen switching costs while compressing the efficiency ratio.
What's holding it back
The $81 billion bond overhang in unrealized losses is a concrete constraint. If rates rise further or credit weakens, this portfolio becomes a capital drag that limits management flexibility. Commercial real estate and office exposure add similar pressure. These risks are embedded in the balance sheet today.
Trading revenue also muddies the signal. Q1 2026 equities trading surged 30%, and Reuters linked this strength directly to turbulent geopolitical conditions. That volatility is a cyclical exposure that can reverse as quickly as it arrives. We don't expect this to be part of the long-term moat compounding.
What to watch
We track four indicators to judge whether the trend is improving or weakening:
You can organize these metrics into a monitoring system using StockIntent's watchlist feature with custom views to track whether Bank of America's moat is improving or weakening over time.
We rate Bank of America's moat uncertainty as Medium. The core deposit franchise is predictable enough to narrow the range of bad outcomes, but cyclical trading revenue, regulatory shifts, and macro sensitivity keep the upside and downside wider than a true utility-like business.
The most stable piece is net interest income. Management raised full-year 2026 NII growth guidance to 6–8%, up from 5–7%, and tied it to visible balance-sheet drivers: loan growth, deposit stability, and runoff of lower-yielding assets. That kind of repeated guidance increase suggests high confidence in the core revenue engine. When a bank can forecast its largest revenue stream with this specificity, the floor on business outcomes rises.
The volatile piece is trading and capital markets. Q1 2026 equities trading revenue surged 30%, and CNBC explicitly linked this to a turbulent geopolitical climate. Reuters later noted that second-quarter market revenue could exceed 15% growth, again driven by market whiplash rather than structural demand. These are real earnings, but they can reverse as quickly as they appear. That lumpiness widens the range of plausible annual outcomes.
Regulatory uncertainty adds another layer. A proposed 10% credit-card cap and evolving capital rules create policy risk that is hard to model. Even the softened Basel III Endgame, which helps today, could be reconsidered through a full credit cycle. From our experience, regulatory relief rarely creates economic moats, but it can widen the competitive gap between scale leaders and regional banks when capital flexibility enables differentiated buyback capacity and investment spending. The uncertainty lies not in whether Bank of America benefits, but in whether regulators sustain the relief through a full credit cycle.
Consumer macro sensitivity rounds out the picture. Inflation and energy costs still influence spending behavior, loan demand, and credit quality. The bank's 92% checking primacy rate keeps customers from fleeing, but it doesn't make them borrow more or spend more when household budgets tighten.
Putting this together, the plausible range over three to five years is moderately narrow for the core franchise but widened by these cyclical and regulatory factors. Bank of America is unlikely to collapse as a competitive force, yet its earnings trajectory carries enough uncertainty that we'd want to see sustained execution before calling the trend definitively widening.
Bank of America earns a Wide economic moat with a Stable trend and Medium uncertainty. That verdict stands on two pillars that are genuinely hard to replicate: switching costs anchored by a 92% checking primacy rate, and a funding cost advantage built on $514.5 billion in zero-cost deposits.
The two developments that could change this view are straightforward. First, whether AI and automation investments translate into sustained efficiency ratio improvement, or merely become another technology spending cycle without measurable payback. Second, how the $81 billion bond overhang resolves. If rates rise further or credit weakens, those unrealized losses could constrain capital flexibility and force trade-offs between growth investment and shareholder returns.
A wide moat describes business quality, not investment timing. The franchise is durable, the core earnings are predictable, and the competitive position is defensible. What remains uncertain is the path of earnings through rate cycles, regulatory shifts, and credit normalization. Watch the efficiency trajectory, NII growth versus the 6–8% guidance, CRE credit quality, and capital return sustainability to judge whether the moat is widening or holding ground.
This content is for informational and educational purposes only and is not investment advice.