
Sep 16, 2026
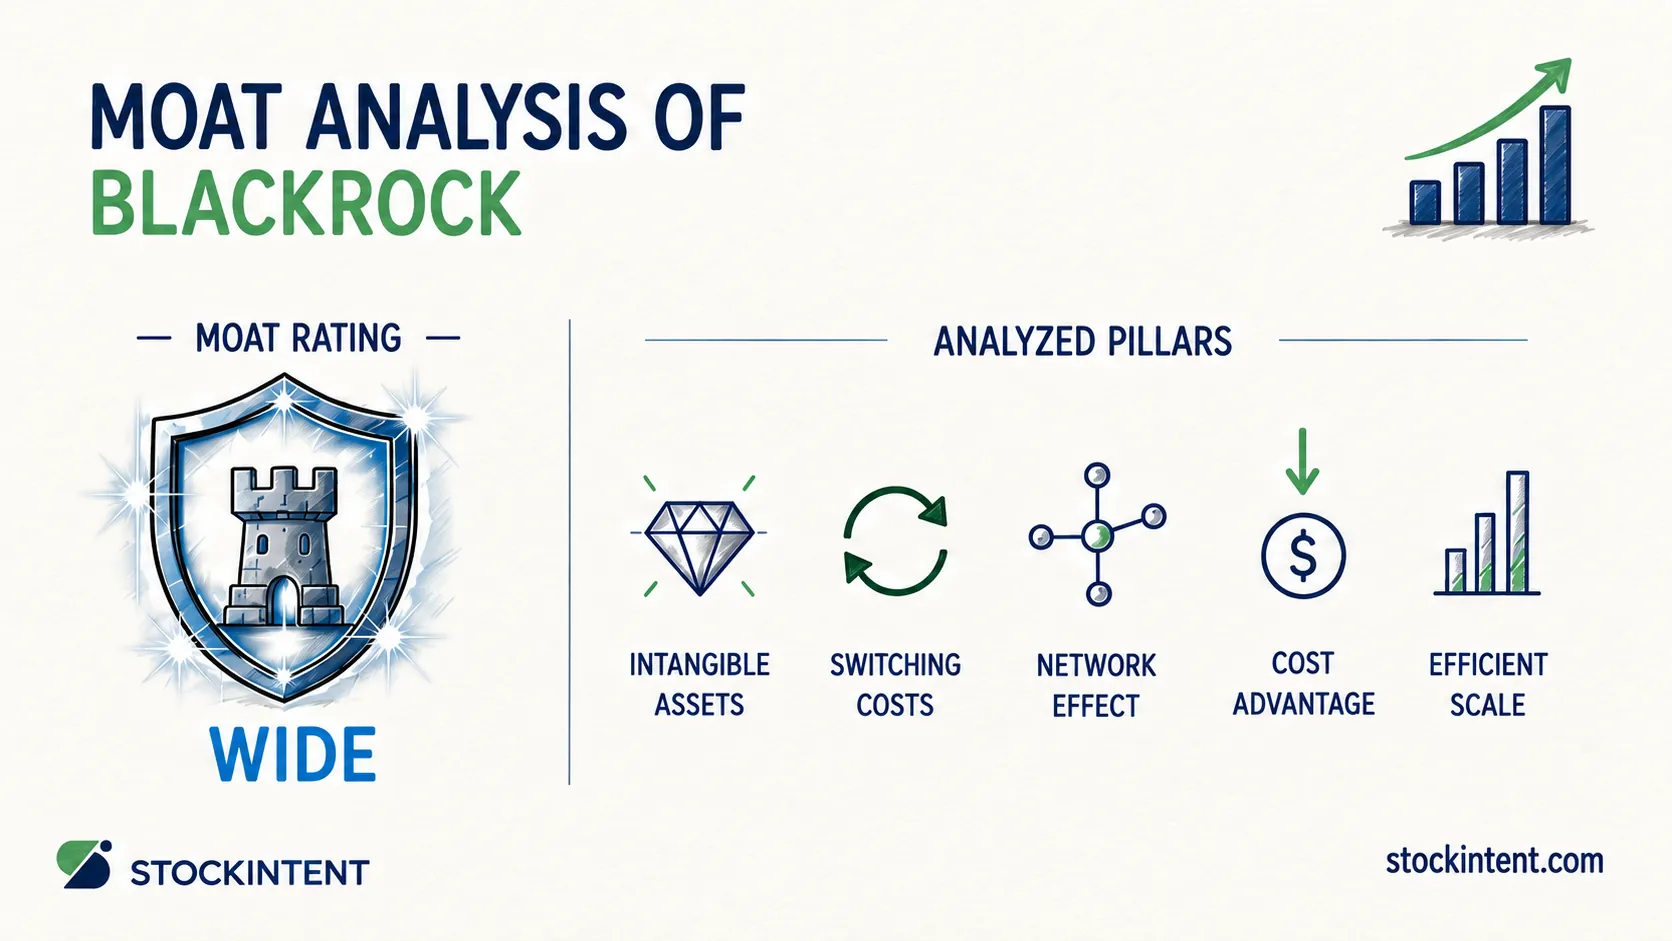
BlackRock carries a Wide economic moat with a Widening trend and Medium uncertainty. As long-term business analysts, we look past quarterly stock fluctuations to evaluate economic durability and capital allocation. BlackRock is seemingly a business firing on all cylinders: in Q2 2026 corporate reports, BlackRock announced assets under management reached a record $15.3 trillion, powered by $192 billion in quarterly net inflows and an adjusted operating margin of 45.9%.
Independent researchers agree with this durable foundation: Morningstar maintained its wide-moat rating on the asset manager following those results.
Here are the core takeaways behind our assessment:
Understanding how these competitive advantages defend investor capital requires breaking down the individual structural pillars.
BlackRock's competitive moat is best analyzed through the classic five-pillar framework, but these pillars do not carry equal weight across its business lines.
Switching Costs (Strong): Institutional clients face massive operational friction when attempting to replace BlackRock's core investment operating system. The Aladdin technology platform runs risk management, portfolio construction, and compliance for hundreds of the world's largest financial institutions. According to BlackRock's Q2 2026 earnings transcript reported by Fortune, Aladdin generated 15% year-over-year annual contract value growth. Replacing such embedded infrastructure introduces operational risk that most chief investment officers simply refuse to take.
Intangible Assets (Strong): Decades of performance consistency and regulatory trust have turned the iShares brand into an institutional standard. As reported by Traders Magazine, iShares crossed $6 trillion in assets in 2026, anchoring model portfolios and advisory platforms worldwide. Brand reputation matters immensely when fiduciaries choose custodian and index partners. Nobody gets fired for picking iShares.
Network Effects (Moderate to Strong): Liquidity creates more liquidity in index products. The firm's $15.3 trillion total asset base enables tighter bid-ask spreads and superior secondary-market trading depth, which naturally attracts more institutional volume. Still, these dynamics remain weaker than consumer software platforms because capital can migrate if fees diverge meaningfully.
Cost Advantage (Moderate): Immense scale allows BlackRock to amortize custody, index licensing, and trading overhead across trillions in assets. The firm aggressively passes these savings down via rock-bottom expense ratios, but low fees are common across modern asset management. Cost efficiency helps BlackRock compete, yet it rarely acts as an exclusive shield without brand recognition.
Efficient Scale (Disputed / Weak): While niche fixed-income offerings benefit from high barrier entries, the wider investment management market remains fragmented. Rivals like Vanguard and State Street coexist profitably, demonstrating that asset management lacks the natural monopoly characteristics required for a pure efficient-scale moat.
Evaluating how competitive advantages translate into high returns on invested capital is central to long-term ownership. When analyzing financial resilience, tools like StockIntent company reports help investors verify whether these structural advantages actually show up in financial metrics like operating margins and returns on capital.
Together, these attributes create a potent "distribution-plus-technology" moat. By using Aladdin's enterprise switching costs to fund capital reinvestment into private markets and low-cost indexing, BlackRock defends its economic returns far better than standalone active managers.
BlackRock's competitive moat is most visible in its sustained fund flows and operating leverage, rather than in standalone pricing power.
We see clear proof of operating leverage in the company's financial progression. Operating margin climbed from 44.5% in Q1 2026 earnings transcripts to 45.9% in Q2 2026. Simultaneously, the firm captured $868 billion in trailing-twelve-month net inflows and generated 10% organic base fee growth. While a 45.9% margin confirms substantial earnings power, we believe the 10% organic base fee growth provides the most meaningful signal for long-term investors. It indicates BlackRock is successfully tilting its asset mix toward higher-value products rather than merely coasting on index fund inertia.
Yet the economic shield has real limits. Explicit pricing power is largely absent in core index products because fierce fee compression caps base fees. Total assets under management also remain exposed to market sentiment: in Q1 2026, asset balances dropped below year-end 2025 levels because market pullbacks offset positive quarterly inflows, as highlighted by Investing.com's earnings analysis.
Compared to peers like Vanguard, which focuses heavily on commoditized index funds, or State Street, which relies heavily on custody servicing, BlackRock pairs broad multi-asset distribution with enterprise software. That combination shields its operating margins even when index fees face pressure.
BlackRock's economic moat trend is Widening. The firm is actively is pulling away from competitors by scaling across multiple distribution lanes at once.
Three concrete developments drive this expanding moat:
Unrivaled flow momentum: In the first half of 2026, BlackRock captured $321 billion in total net inflows, punctuated by $192 billion in the second quarter alone. Its core ETF franchise remains unmatched, gathering $132 billion in Q1 and $178 billion in Q2.
Compounding enterprise technology: Technology revenue continues to outpace traditional asset growth. Aladdin posted 15% annual contract value growth in Q2 2026, deepening institutional entrenchment.
Private markets expansion: Strategic integration of Global Infrastructure Partners (GIP) and HPS Investment Partners allows BlackRock to cross-sell higher-fee, private credit and infrastructure mandates to its existing client base.
The competitive landscape is polarizing. Plain-vanilla index funds face ongoing price competition, which forces asset managers to either achieve massive scale or get squeezed out. BlackRock operates on the winning side of that divide. However, sustaining this widening trajectory requires high-margin private assets and technology fees to grow quickly enough to outpace structural fee compression in passive products.
To evaluate whether this competitive advantage keeps expanding or starts facing friction, we focus on four forward-looking metrics:
Tracking these variables manually across earnings releases takes work. Investors can use StockIntent's watchlist feature to build custom monitoring views around key financial metrics to detect early shifts in business durability.
We assign BlackRock a Medium uncertainty rating. This rating does not reflect concerns over balance sheet solvency or existential market disruption. Instead, it captures the dispersion of business outcomes tied to top-line market exposure and complex execution demands.
Three primary dynamics drive this uncertainty:
Market-driven revenue volatility: In Q2 2026 earnings disclosures, revenue surged 31% year-over-year. That top-line acceleration was substantially lifted by broad equity appreciation rather than pure organic expansion. While BlackRock's 2026 proxy statement cited 16% technology services annual contract value growth in 2025 as a steadying force, market-sensitive base fees still dominate overall earnings.
Execution and technology risks: Integrating massive private market platforms like GIP and HPS brings real operational friction, culture clashes, and retention hurdles. Meanwhile, the BlackRock Investment Institute's 2026 outlook noted that heavy AI capital spending across industries is front-loaded while ultimate revenue capture remains uncertain, introducing questions about software monetization timelines.
External political and regulatory scrutiny: As the world's largest asset manager, BlackRock faces persistent friction around ESG policies, fiduciary standards, and private-market disclosures.
Pro Insight: Investors often mistake BlackRock's massive scale for low business uncertainty. We view that as a fundamental error. The next five years depend heavily on executing a complex mix shift from commoditized, low-fee index funds into higher-margin private credit and infrastructure. Scale alone cannot guarantee seamless integration, cultural alignment, or swift institutional adoption across new asset classes.
Unlike consumer staples companies with predictable repeat unit purchases, BlackRock's earnings power remains tied to market beta and execution quality across evolving asset classes.
BlackRock maintains a Wide economic moat with a Widening trend and Medium uncertainty. Its competitive position rests on high enterprise switching costs via Aladdin and dominant intangible assets in the iShares brand. Record assets of $15.3 trillion and $868 billion in trailing-twelve-month net inflows demonstrate exceptional client demand. Furthermore, 15% Aladdin annual contract value growth reinforces that the moat continues to expand beyond traditional asset management.
Still, long-term business durability hinges on two critical execution variables. First, private market initiatives must gather assets quickly enough to offset relentless fee compression across core exchange-traded funds. Second, integrating large acquisitions must protect operating margins above 45% without creating operational drag. Market declines like those seen in early 2026 remind us that broad equity beta still influences asset levels.
For thoughtful long-term investors, the priority now is tracking the four forward indicators: ETF inflows, technology growth, private market commitments, and operating margins. These metrics will reveal whether BlackRock's widening moat stays durable over time.
BlackRock carries a Wide economic moat with a Widening trend and Medium uncertainty. As long-term business analysts, we look past quarterly stock fluctuations to evaluate economic durability and capital allocation. BlackRock is seemingly a business firing on all cylinders: in Q2 2026 corporate reports, BlackRock announced assets under management reached a record $15.3 trillion, powered by $192 billion in quarterly net inflows and an adjusted operating margin of 45.9%.
Independent researchers agree with this durable foundation: Morningstar maintained its wide-moat rating on the asset manager following those results.
Here are the core takeaways behind our assessment:
Understanding how these competitive advantages defend investor capital requires breaking down the individual structural pillars.
BlackRock's competitive moat is best analyzed through the classic five-pillar framework, but these pillars do not carry equal weight across its business lines.
Switching Costs (Strong): Institutional clients face massive operational friction when attempting to replace BlackRock's core investment operating system. The Aladdin technology platform runs risk management, portfolio construction, and compliance for hundreds of the world's largest financial institutions. According to BlackRock's Q2 2026 earnings transcript reported by Fortune, Aladdin generated 15% year-over-year annual contract value growth. Replacing such embedded infrastructure introduces operational risk that most chief investment officers simply refuse to take.
Intangible Assets (Strong): Decades of performance consistency and regulatory trust have turned the iShares brand into an institutional standard. As reported by Traders Magazine, iShares crossed $6 trillion in assets in 2026, anchoring model portfolios and advisory platforms worldwide. Brand reputation matters immensely when fiduciaries choose custodian and index partners. Nobody gets fired for picking iShares.
Network Effects (Moderate to Strong): Liquidity creates more liquidity in index products. The firm's $15.3 trillion total asset base enables tighter bid-ask spreads and superior secondary-market trading depth, which naturally attracts more institutional volume. Still, these dynamics remain weaker than consumer software platforms because capital can migrate if fees diverge meaningfully.
Cost Advantage (Moderate): Immense scale allows BlackRock to amortize custody, index licensing, and trading overhead across trillions in assets. The firm aggressively passes these savings down via rock-bottom expense ratios, but low fees are common across modern asset management. Cost efficiency helps BlackRock compete, yet it rarely acts as an exclusive shield without brand recognition.
Efficient Scale (Disputed / Weak): While niche fixed-income offerings benefit from high barrier entries, the wider investment management market remains fragmented. Rivals like Vanguard and State Street coexist profitably, demonstrating that asset management lacks the natural monopoly characteristics required for a pure efficient-scale moat.
Evaluating how competitive advantages translate into high returns on invested capital is central to long-term ownership. When analyzing financial resilience, tools like StockIntent company reports help investors verify whether these structural advantages actually show up in financial metrics like operating margins and returns on capital.
Together, these attributes create a potent "distribution-plus-technology" moat. By using Aladdin's enterprise switching costs to fund capital reinvestment into private markets and low-cost indexing, BlackRock defends its economic returns far better than standalone active managers.
BlackRock's competitive moat is most visible in its sustained fund flows and operating leverage, rather than in standalone pricing power.
We see clear proof of operating leverage in the company's financial progression. Operating margin climbed from 44.5% in Q1 2026 earnings transcripts to 45.9% in Q2 2026. Simultaneously, the firm captured $868 billion in trailing-twelve-month net inflows and generated 10% organic base fee growth. While a 45.9% margin confirms substantial earnings power, we believe the 10% organic base fee growth provides the most meaningful signal for long-term investors. It indicates BlackRock is successfully tilting its asset mix toward higher-value products rather than merely coasting on index fund inertia.
Yet the economic shield has real limits. Explicit pricing power is largely absent in core index products because fierce fee compression caps base fees. Total assets under management also remain exposed to market sentiment: in Q1 2026, asset balances dropped below year-end 2025 levels because market pullbacks offset positive quarterly inflows, as highlighted by Investing.com's earnings analysis.
Compared to peers like Vanguard, which focuses heavily on commoditized index funds, or State Street, which relies heavily on custody servicing, BlackRock pairs broad multi-asset distribution with enterprise software. That combination shields its operating margins even when index fees face pressure.
BlackRock's economic moat trend is Widening. The firm is actively is pulling away from competitors by scaling across multiple distribution lanes at once.
Three concrete developments drive this expanding moat:
Unrivaled flow momentum: In the first half of 2026, BlackRock captured $321 billion in total net inflows, punctuated by $192 billion in the second quarter alone. Its core ETF franchise remains unmatched, gathering $132 billion in Q1 and $178 billion in Q2.
Compounding enterprise technology: Technology revenue continues to outpace traditional asset growth. Aladdin posted 15% annual contract value growth in Q2 2026, deepening institutional entrenchment.
Private markets expansion: Strategic integration of Global Infrastructure Partners (GIP) and HPS Investment Partners allows BlackRock to cross-sell higher-fee, private credit and infrastructure mandates to its existing client base.
The competitive landscape is polarizing. Plain-vanilla index funds face ongoing price competition, which forces asset managers to either achieve massive scale or get squeezed out. BlackRock operates on the winning side of that divide. However, sustaining this widening trajectory requires high-margin private assets and technology fees to grow quickly enough to outpace structural fee compression in passive products.
To evaluate whether this competitive advantage keeps expanding or starts facing friction, we focus on four forward-looking metrics:
Tracking these variables manually across earnings releases takes work. Investors can use StockIntent's watchlist feature to build custom monitoring views around key financial metrics to detect early shifts in business durability.
We assign BlackRock a Medium uncertainty rating. This rating does not reflect concerns over balance sheet solvency or existential market disruption. Instead, it captures the dispersion of business outcomes tied to top-line market exposure and complex execution demands.
Three primary dynamics drive this uncertainty:
Market-driven revenue volatility: In Q2 2026 earnings disclosures, revenue surged 31% year-over-year. That top-line acceleration was substantially lifted by broad equity appreciation rather than pure organic expansion. While BlackRock's 2026 proxy statement cited 16% technology services annual contract value growth in 2025 as a steadying force, market-sensitive base fees still dominate overall earnings.
Execution and technology risks: Integrating massive private market platforms like GIP and HPS brings real operational friction, culture clashes, and retention hurdles. Meanwhile, the BlackRock Investment Institute's 2026 outlook noted that heavy AI capital spending across industries is front-loaded while ultimate revenue capture remains uncertain, introducing questions about software monetization timelines.
External political and regulatory scrutiny: As the world's largest asset manager, BlackRock faces persistent friction around ESG policies, fiduciary standards, and private-market disclosures.
Pro Insight: Investors often mistake BlackRock's massive scale for low business uncertainty. We view that as a fundamental error. The next five years depend heavily on executing a complex mix shift from commoditized, low-fee index funds into higher-margin private credit and infrastructure. Scale alone cannot guarantee seamless integration, cultural alignment, or swift institutional adoption across new asset classes.
Unlike consumer staples companies with predictable repeat unit purchases, BlackRock's earnings power remains tied to market beta and execution quality across evolving asset classes.
BlackRock maintains a Wide economic moat with a Widening trend and Medium uncertainty. Its competitive position rests on high enterprise switching costs via Aladdin and dominant intangible assets in the iShares brand. Record assets of $15.3 trillion and $868 billion in trailing-twelve-month net inflows demonstrate exceptional client demand. Furthermore, 15% Aladdin annual contract value growth reinforces that the moat continues to expand beyond traditional asset management.
Still, long-term business durability hinges on two critical execution variables. First, private market initiatives must gather assets quickly enough to offset relentless fee compression across core exchange-traded funds. Second, integrating large acquisitions must protect operating margins above 45% without creating operational drag. Market declines like those seen in early 2026 remind us that broad equity beta still influences asset levels.
For thoughtful long-term investors, the priority now is tracking the four forward indicators: ETF inflows, technology growth, private market commitments, and operating margins. These metrics will reveal whether BlackRock's widening moat stays durable over time.