
Aug 4, 2026
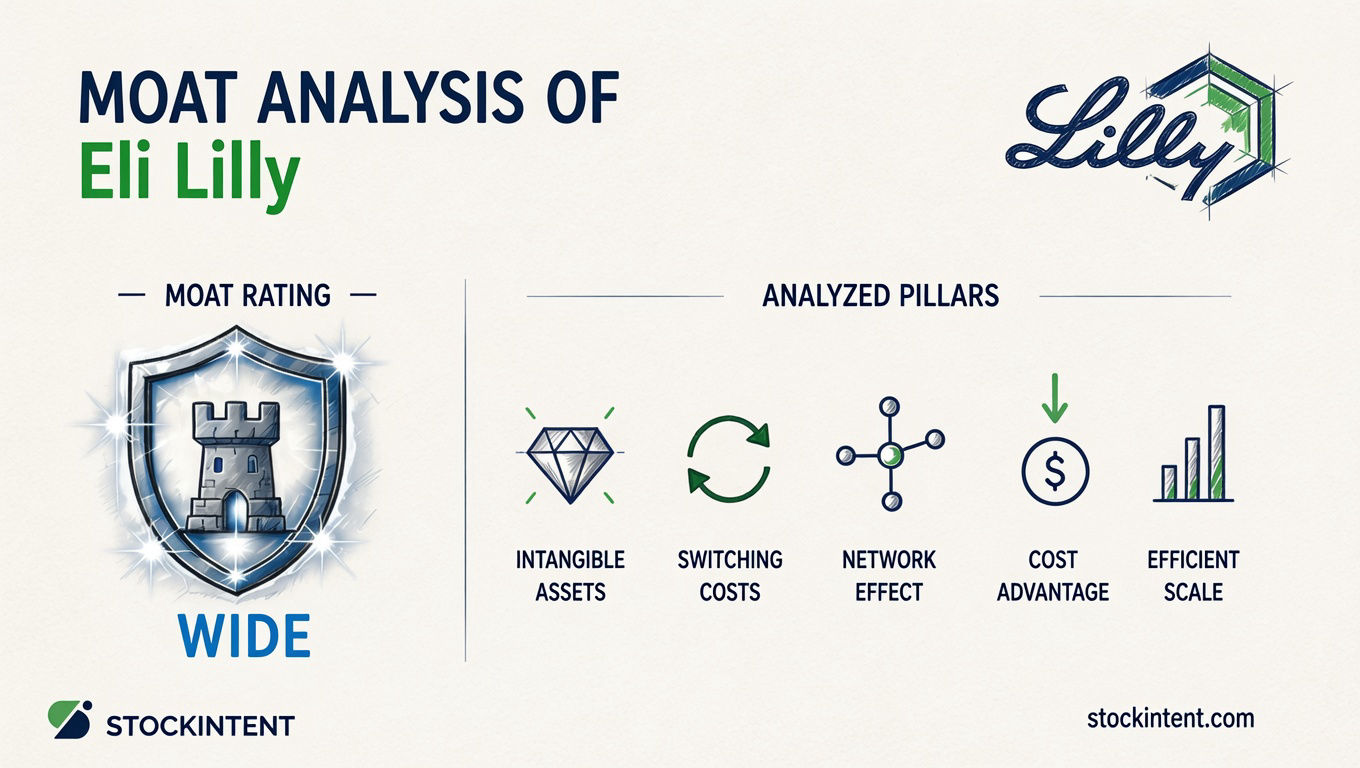
Eli Lilly carries a Wide moat with a Stable trend and Medium uncertainty as of mid-2026. The company's competitive position rests on formidable intangible assets, patent-protected GLP-1 leadership, and manufacturing scale that rivals struggle to match. Yet that strength is concentrated in a single therapeutic category, and pricing pressure is already visible in the numbers.
In Q1 2026, Lilly reported revenue of $19.8 billion, up 56% year-over-year, and raised full-year guidance to $82.0–$85.0 billion. That growth was driven by 65% volume expansion, though realized prices on Mounjaro and Zepbound declined 13% over the same period. The trade-off is clear: Lilly is capturing massive market share, but not without sacrificing some pricing power.
For investors focused on business quality, the question isn't whether Lilly is dominant today. It clearly is. The deeper question is whether that dominance translates into durable, compounding returns over the next decade, or whether concentration and pricing pressure erode the economics faster than the market expects.
The sections that follow break down each moat pillar, how they show up in financial performance, and the specific developments that could strengthen or weaken this assessment over the next three to five years.
Lilly's moat rests primarily on intangible assets, with meaningful but narrower contributions from efficient scale and moderate switching costs. Two pillars, network effects and cost advantage, are either irrelevant or weaker than they first appear. Here's how each of the five standard moat pillars applies to Eli Lilly as of mid-2026.
Pro Insight: From a capital allocation perspective, the $50 billion manufacturing buildout is best understood as reinvestment to defend the moat through supply reliability and scale, not as a separate cost advantage. That aligns with how we think about durable compounding: the returns on reinvestment matter as much as the current margin profile. Investors reviewing detailed company reports can examine patent cliffs, pipeline data, and regulatory timelines to assess how long the intangible assets pillar will remain intact.
Lilly's competitive advantages are already translating into exceptional operating results, though with a telling tension between volume dominance and pricing pressure.
In Q1 2026, the company delivered $19.8 billion in revenue, up 56% year-over-year. That growth came from 65% volume expansion, offset by a 13% decline in realized prices on Mounjaro and Zepbound. The math is striking: Lilly is capturing massive market share, but it's trading margin for volume to do it.
The profitability profile remains extraordinary. For fiscal year 2025, Artificall's analysis estimates gross margin near 83%, EBIT margin around 40%, and return on invested capital at approximately 30%. These figures place Lilly well above typical pharmaceutical economics and suggest the moat is generating genuine excess returns, at least for now.
Still, the pressure points are visible. Pricing power, traditionally the cleanest signal of a wide moat, is under strain. The 13% price erosion in Q1 2026 reflects payer scrutiny and formulary negotiations that aren't going away. Volume growth can mask this for quarters or even years, but sustained compression in realized prices eventually feeds through to returns.
From our perspective, the key question isn't whether Lilly's moat exists in the numbers. It clearly does. The question is whether current margins and ROIC represent a durable situation or a temporary peak supported by supply-constrained demand.
Pro Tip: Investors seeking comparable quality compounders can use fundamental screens to identify other companies exhibiting similar high ROIC and margin profiles across sectors.
We rate Eli Lilly's moat trend as stable to widening. The nuance matters: Lilly is winning on volume, manufacturing scale, and distribution reach, but it's trading margin to do so. That creates a conflicting picture where the structural position improves even as economic returns face pressure.
On the widening side, several developments are working in Lilly's favor. The company has committed over $50 billion to U.S. manufacturing expansion since 2020, turning supply reliability into a competitive weapon in a market where demand still outstrips production capacity. LillyDirect, the direct-to-patient distribution channel, is reducing pharmacy bottlenecks and improving patient retention. Most significantly, the FDA approved oral GLP-1 therapy orforglipron (Foundayo) in Q1 2026, potentially expanding the addressable market to patients who prefer pills over injections. Market share versus Novo Nordisk is widening, and Drug Discovery Trends noted in 2026 that Lilly is on track to become the largest pharmaceutical company by revenue.
Yet the stable-to-pressured side is equally real. Net price erosion is accelerating. In Q1 2026, realized prices on Mounjaro and Zepbound fell 13% despite 65% volume growth. Reuters reported that this pricing pressure reflects intensifying payer scrutiny and formulary negotiations. The moat is capturing patients, but not at the same economics as before.
From Our Experience: There's an important distinction between winning market share and widening an economic moat. Lilly is clearly doing the former. But when a company trades 13% pricing for volume growth, its moat is expanding in market structure and distribution reach while compressing in pure economic terms. We'd call that stable rather than unambiguously widening, even if the competitive position looks stronger than a year ago.
For investors tracking this over the next three to five years, four indicators matter most:
The trend would shift to clearly widening if oral uptake explodes, pricing stabilizes, and pipeline diversification succeeds. It would weaken if manufacturing stumbles, price erosion outpaces volume gains, or competitors close the efficacy gap faster than expected.
We assign Eli Lilly a Medium uncertainty rating. The moat is real and well supported by current evidence, but the range of plausible outcomes over the next three to five years is wider than a typical mature pharmaceutical company.
Three factors drive this assessment. First, revenue concentration remains extreme. Mounjaro and Zepbound generated $36.5 billion in 2025, representing more than half of total company sales. That dominance is a strength today, but it becomes a vulnerability if pricing, safety, or competitive dynamics shift in this single therapeutic category.
Second, pricing pressure is already measurable, not theoretical. In Q1 2026, realized prices on Mounjaro and Zepbound declined 13% year-over-year. That erosion reflects payer scrutiny and formulary negotiations that are likely to intensify as the market matures. The moat is capturing volume, but not at constant economics.
Third, execution risk is substantial. Lilly must scale manufacturing, convert oral GLP-1 interest into durable prescriptions, and advance pipeline candidates like retatrutide, all while defending its existing franchise. The $50 billion U.S. manufacturing commitment is a bet that supply reliability itself becomes a barrier. If execution lags, that capital could strain returns rather than compound them.
For investors, medium uncertainty means the moat assessment is grounded in strong current evidence, but not immune to surprises.
Eli Lilly earns a Wide moat with a Stable trend and Medium uncertainty. Its intangible assets, manufacturing scale, and dominant GLP-1 position are generating exceptional volume growth and returns on capital that few peers can match. The Q1 2026 results make this clear: 56% revenue growth and raised full-year guidance to $82.0–$85.0 billion demonstrate a company operating from genuine competitive strength.
Still, the moat is not without limits. Revenue concentration in Mounjaro and Zepbound, combined with accelerating price erosion, creates a narrower band of safety than the headline growth suggests. The 13% realized price decline in Q1 2026 is not a one-off; it reflects structural payer pressure that will likely intensify as the market matures.
For investors, the practical task is monitoring four indicators: oral GLP-1 uptake for orforglipron, gross-to-net pricing trends, manufacturing execution, and pipeline conversion beyond the current franchise. These will determine whether Lilly's moat trends toward widening or faces gradual compression. Investors can organize these into a repeatable tracking system using watchlist tools to stay on top of developments as they unfold.
Eli Lilly carries a Wide moat with a Stable trend and Medium uncertainty as of mid-2026. The company's competitive position rests on formidable intangible assets, patent-protected GLP-1 leadership, and manufacturing scale that rivals struggle to match. Yet that strength is concentrated in a single therapeutic category, and pricing pressure is already visible in the numbers.
In Q1 2026, Lilly reported revenue of $19.8 billion, up 56% year-over-year, and raised full-year guidance to $82.0–$85.0 billion. That growth was driven by 65% volume expansion, though realized prices on Mounjaro and Zepbound declined 13% over the same period. The trade-off is clear: Lilly is capturing massive market share, but not without sacrificing some pricing power.
For investors focused on business quality, the question isn't whether Lilly is dominant today. It clearly is. The deeper question is whether that dominance translates into durable, compounding returns over the next decade, or whether concentration and pricing pressure erode the economics faster than the market expects.
The sections that follow break down each moat pillar, how they show up in financial performance, and the specific developments that could strengthen or weaken this assessment over the next three to five years.
Lilly's moat rests primarily on intangible assets, with meaningful but narrower contributions from efficient scale and moderate switching costs. Two pillars, network effects and cost advantage, are either irrelevant or weaker than they first appear. Here's how each of the five standard moat pillars applies to Eli Lilly as of mid-2026.
Pro Insight: From a capital allocation perspective, the $50 billion manufacturing buildout is best understood as reinvestment to defend the moat through supply reliability and scale, not as a separate cost advantage. That aligns with how we think about durable compounding: the returns on reinvestment matter as much as the current margin profile. Investors reviewing detailed company reports can examine patent cliffs, pipeline data, and regulatory timelines to assess how long the intangible assets pillar will remain intact.
Lilly's competitive advantages are already translating into exceptional operating results, though with a telling tension between volume dominance and pricing pressure.
In Q1 2026, the company delivered $19.8 billion in revenue, up 56% year-over-year. That growth came from 65% volume expansion, offset by a 13% decline in realized prices on Mounjaro and Zepbound. The math is striking: Lilly is capturing massive market share, but it's trading margin for volume to do it.
The profitability profile remains extraordinary. For fiscal year 2025, Artificall's analysis estimates gross margin near 83%, EBIT margin around 40%, and return on invested capital at approximately 30%. These figures place Lilly well above typical pharmaceutical economics and suggest the moat is generating genuine excess returns, at least for now.
Still, the pressure points are visible. Pricing power, traditionally the cleanest signal of a wide moat, is under strain. The 13% price erosion in Q1 2026 reflects payer scrutiny and formulary negotiations that aren't going away. Volume growth can mask this for quarters or even years, but sustained compression in realized prices eventually feeds through to returns.
From our perspective, the key question isn't whether Lilly's moat exists in the numbers. It clearly does. The question is whether current margins and ROIC represent a durable situation or a temporary peak supported by supply-constrained demand.
Pro Tip: Investors seeking comparable quality compounders can use fundamental screens to identify other companies exhibiting similar high ROIC and margin profiles across sectors.
We rate Eli Lilly's moat trend as stable to widening. The nuance matters: Lilly is winning on volume, manufacturing scale, and distribution reach, but it's trading margin to do so. That creates a conflicting picture where the structural position improves even as economic returns face pressure.
On the widening side, several developments are working in Lilly's favor. The company has committed over $50 billion to U.S. manufacturing expansion since 2020, turning supply reliability into a competitive weapon in a market where demand still outstrips production capacity. LillyDirect, the direct-to-patient distribution channel, is reducing pharmacy bottlenecks and improving patient retention. Most significantly, the FDA approved oral GLP-1 therapy orforglipron (Foundayo) in Q1 2026, potentially expanding the addressable market to patients who prefer pills over injections. Market share versus Novo Nordisk is widening, and Drug Discovery Trends noted in 2026 that Lilly is on track to become the largest pharmaceutical company by revenue.
Yet the stable-to-pressured side is equally real. Net price erosion is accelerating. In Q1 2026, realized prices on Mounjaro and Zepbound fell 13% despite 65% volume growth. Reuters reported that this pricing pressure reflects intensifying payer scrutiny and formulary negotiations. The moat is capturing patients, but not at the same economics as before.
From Our Experience: There's an important distinction between winning market share and widening an economic moat. Lilly is clearly doing the former. But when a company trades 13% pricing for volume growth, its moat is expanding in market structure and distribution reach while compressing in pure economic terms. We'd call that stable rather than unambiguously widening, even if the competitive position looks stronger than a year ago.
For investors tracking this over the next three to five years, four indicators matter most:
The trend would shift to clearly widening if oral uptake explodes, pricing stabilizes, and pipeline diversification succeeds. It would weaken if manufacturing stumbles, price erosion outpaces volume gains, or competitors close the efficacy gap faster than expected.
We assign Eli Lilly a Medium uncertainty rating. The moat is real and well supported by current evidence, but the range of plausible outcomes over the next three to five years is wider than a typical mature pharmaceutical company.
Three factors drive this assessment. First, revenue concentration remains extreme. Mounjaro and Zepbound generated $36.5 billion in 2025, representing more than half of total company sales. That dominance is a strength today, but it becomes a vulnerability if pricing, safety, or competitive dynamics shift in this single therapeutic category.
Second, pricing pressure is already measurable, not theoretical. In Q1 2026, realized prices on Mounjaro and Zepbound declined 13% year-over-year. That erosion reflects payer scrutiny and formulary negotiations that are likely to intensify as the market matures. The moat is capturing volume, but not at constant economics.
Third, execution risk is substantial. Lilly must scale manufacturing, convert oral GLP-1 interest into durable prescriptions, and advance pipeline candidates like retatrutide, all while defending its existing franchise. The $50 billion U.S. manufacturing commitment is a bet that supply reliability itself becomes a barrier. If execution lags, that capital could strain returns rather than compound them.
For investors, medium uncertainty means the moat assessment is grounded in strong current evidence, but not immune to surprises.
Eli Lilly earns a Wide moat with a Stable trend and Medium uncertainty. Its intangible assets, manufacturing scale, and dominant GLP-1 position are generating exceptional volume growth and returns on capital that few peers can match. The Q1 2026 results make this clear: 56% revenue growth and raised full-year guidance to $82.0–$85.0 billion demonstrate a company operating from genuine competitive strength.
Still, the moat is not without limits. Revenue concentration in Mounjaro and Zepbound, combined with accelerating price erosion, creates a narrower band of safety than the headline growth suggests. The 13% realized price decline in Q1 2026 is not a one-off; it reflects structural payer pressure that will likely intensify as the market matures.
For investors, the practical task is monitoring four indicators: oral GLP-1 uptake for orforglipron, gross-to-net pricing trends, manufacturing execution, and pipeline conversion beyond the current franchise. These will determine whether Lilly's moat trends toward widening or faces gradual compression. Investors can organize these into a repeatable tracking system using watchlist tools to stay on top of developments as they unfold.