
Sep 19, 2026
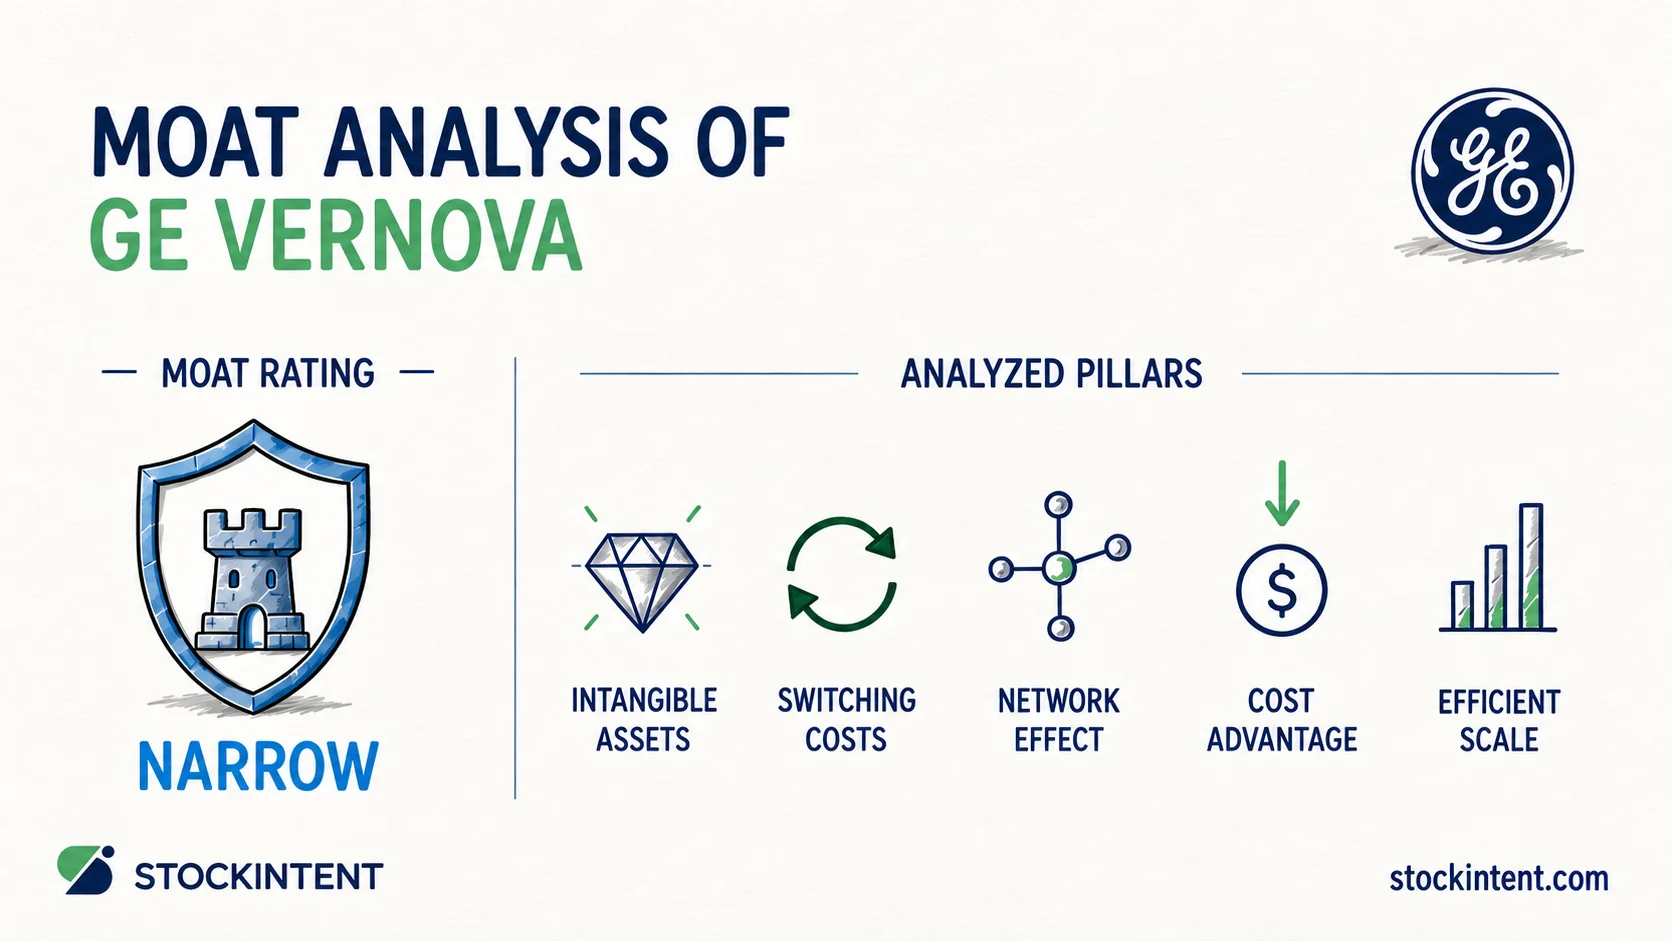
We assess GE Vernova as possessing a narrow economic moat, a widening moat trend, and a medium uncertainty rating.
In Q2 2026 financial results, the company reported adjusted EBITDA of $1.2 billion with an 11.3% adjusted EBITDA margin, up 340 basis points organically, backed by a massive total backlog of $176 billion.
Evaluating industrial cyclical businesses can feel like navigating a minefield, especially when trying to separate genuine business compounders from companies that are simply riding a temporary demand wave.
Here are the core takeaways from our moat assessment:
For long-term business owners, the central question is whether these competitive advantages will protect excess economic returns once the current grid-investment cycle cools.
Durable excess economic returns stem from structural customer captivity and specialized technical differentiation, not merely cyclical demand or low valuation multiples. To judge whether GE Vernova can protect its margins over a full decade, we evaluate the business across the five classic economic moat pillars.
Switching costs serve as the foundation of GE Vernova's competitive defense. According to GE Vernova Investor Relations, the company maintains an active installed base of roughly 59,000 turbines and over 120 GW of installed wind capacity globally. Power plants and utility grids cannot easily swap vendors once physical equipment is bolted to the ground.
This equipment scale locks in high-margin aftermarket contracts. Services represent approximately $88 billion, or more than 55% of the total backlog. Routine servicing, digital monitoring, proprietary replacement parts, and planned turbine upgrades create predictable, recurring cash flow while deterring third-party replacements.
Complex turbine engineering, grid integration know-how, and decade-long customer relationships create meaningful intangible advantages. Heavy electrical utilities prioritize operational reliability over small upfront price discounts. That dynamic favors established suppliers with proven safety records. While GE Vernova does not rely entirely on patent exclusivity, its design capabilities and established reputation make it a default vendor for mission-critical grid projects.
Building heavy gas turbines and high-voltage grid systems requires vast manufacturing facilities and capital investment. Only a handful of global manufacturers possess the scale to supply massive utility projects. However, the end market is too large to create a classic natural monopoly, and well-capitalized global competitors ensure that market pricing discipline is periodically tested.
GE Vernova does not show clear evidence of an enduring structural cost moat. Management disclosed an estimated $250 million to $350 million in tariff cost pressures for 2026 in a Reuters report. The company remains vulnerable to raw material price inflation and global trade frictions, requiring ongoing investments in factory automation rather than enjoying a natural raw-material or structural labor edge.
Network effects do not play a material role in this business model. Adding another gas turbine in Ohio does not make a turbine operating in Germany more valuable. Growth generates manufacturing scale, but it does not unlock true two-sided network flywheels.
Pro Insight: GE Vernova's economic moat relies on installed-base captivity and high switching costs, not platform network effects. While the 59,000-turbine base locks in lucrative services for Gas Power and Electrification, the Wind segment remains an unproven pillar that continues to dilute portfolio returns.
Competitive advantages are only as credible as the financial results they produce. For GE Vernova, evidence of an economic moat appears most clearly in Power segment margins and pricing power. In Q2 2026, the Power division delivered an adjusted EBITDA margin of 18.8%, according to the Q2 2026 earnings call transcript. This margin expansion demonstrates that management is converting severe industry capacity constraints into genuine bottom-line gains.
Pricing power provides the clearest proof of customer captivity. In its Q2 2026 results webcast, management noted that first-half 2026 equipment orders were priced more than 20% higher than Q4 2025 bookings. Utilities are willing to absorb steep price increases to lock in scarce manufacturing slots, proving that GE Vernova possesses tangible bargaining leverage in power equipment.
Yet the expected benefits of this moat remain uneven across the broader portfolio. The Wind segment remains an unprofitable drag, lacking the steady pricing gains and high aftermarket service margins seen in thermal power. That division dilutes overall consolidated returns on capital.
This dynamic creates an analytical tension for investors. Today's profit surge reflects disciplined commercial execution, but it also rides a strong power infrastructure cycle. Whether these higher backlog margins persist once manufacturing bottlenecks ease remains the ultimate test of GE Vernova's economic moat.
We judge GE Vernova's economic moat trend to be widening. The company's competitive position is expanding across conventional power and grid systems as load growth from artificial intelligence data centers, manufacturing reshoring, and broad electrification accelerates delivery lead times.
Scarcity in production capacity is shifting pricing power directly toward established turbine makers. Customers are no longer waiting until final investment decisions to procure equipment; they are actively securing early factory slots. According to GE Vernova's multi-year outlook update, management raised its 2028 adjusted EBITDA margin target to 20%, up from its previous 14% expectation. That revision reflects growing confidence that recent commercial pricing gains represent structural improvements rather than a transient burst.
The clearest operational evidence of this widening trend sits in Gas Power equipment bookings. Slot reservations and firm equipment backlog expanded from 83 gigawatts before 2026 to 100 GW in Q1, reached 116 GW by Q2, and management expects at least 125 GW by year-end 2026. This dynamic locks in high-visibility demand through the end of the decade, making it exceptionally difficult for rivals to displace GE Vernova in heavy dispatchable power.
Still, the trend remains mixed across segments. Wind continues to face execution hurdles and lower margins, preventing a wider across-the-board moat expansion. To evaluate whether GE Vernova's moat is truly widening or merely experiencing a cyclical boom, investors should monitor four key operational signposts on watchlists:
We assign GE Vernova a medium uncertainty rating. While long-term visibility has improved considerably compared to prior years, the plausible range of business outcomes over the next three to five years remains moderately wide.
Three operational and market realities shape this uncertainty profile:
This range of outcomes directly affects moat durability. If management delivers on its raised 2028 target of 20% adjusted EBITDA margins, GE Vernova will demonstrate that its competitive advantage is structural. Conversely, conversion stumbles or a demand downcycle would indicate that recent gains were mostly cyclical.
Our assessment concludes that GE Vernova possesses a narrow economic moat, a widening moat trend, and a medium uncertainty rating. The foundation of this competitive advantage rests on strong switching costs from its massive installed base, rapid backlog growth to $176 billion, first-half equipment pricing gains of over 20%, and Power segment EBITDA margins of 18.8%.
From here, long-term investors should track two critical issues:
Flawless operational execution and steady backlog conversion toward the $200 billion target, paired with hitting the 20% margin target by 2028, would build a compelling case for a wide moat upgrade. However, project delivery delays, margin compression, or order cancellations would prove that current economics remain tethered to the power cycle.
This content is for informational or educational purposes and is not investment advice.
We assess GE Vernova as possessing a narrow economic moat, a widening moat trend, and a medium uncertainty rating.
In Q2 2026 financial results, the company reported adjusted EBITDA of $1.2 billion with an 11.3% adjusted EBITDA margin, up 340 basis points organically, backed by a massive total backlog of $176 billion.
Evaluating industrial cyclical businesses can feel like navigating a minefield, especially when trying to separate genuine business compounders from companies that are simply riding a temporary demand wave.
Here are the core takeaways from our moat assessment:
For long-term business owners, the central question is whether these competitive advantages will protect excess economic returns once the current grid-investment cycle cools.
Durable excess economic returns stem from structural customer captivity and specialized technical differentiation, not merely cyclical demand or low valuation multiples. To judge whether GE Vernova can protect its margins over a full decade, we evaluate the business across the five classic economic moat pillars.
Switching costs serve as the foundation of GE Vernova's competitive defense. According to GE Vernova Investor Relations, the company maintains an active installed base of roughly 59,000 turbines and over 120 GW of installed wind capacity globally. Power plants and utility grids cannot easily swap vendors once physical equipment is bolted to the ground.
This equipment scale locks in high-margin aftermarket contracts. Services represent approximately $88 billion, or more than 55% of the total backlog. Routine servicing, digital monitoring, proprietary replacement parts, and planned turbine upgrades create predictable, recurring cash flow while deterring third-party replacements.
Complex turbine engineering, grid integration know-how, and decade-long customer relationships create meaningful intangible advantages. Heavy electrical utilities prioritize operational reliability over small upfront price discounts. That dynamic favors established suppliers with proven safety records. While GE Vernova does not rely entirely on patent exclusivity, its design capabilities and established reputation make it a default vendor for mission-critical grid projects.
Building heavy gas turbines and high-voltage grid systems requires vast manufacturing facilities and capital investment. Only a handful of global manufacturers possess the scale to supply massive utility projects. However, the end market is too large to create a classic natural monopoly, and well-capitalized global competitors ensure that market pricing discipline is periodically tested.
GE Vernova does not show clear evidence of an enduring structural cost moat. Management disclosed an estimated $250 million to $350 million in tariff cost pressures for 2026 in a Reuters report. The company remains vulnerable to raw material price inflation and global trade frictions, requiring ongoing investments in factory automation rather than enjoying a natural raw-material or structural labor edge.
Network effects do not play a material role in this business model. Adding another gas turbine in Ohio does not make a turbine operating in Germany more valuable. Growth generates manufacturing scale, but it does not unlock true two-sided network flywheels.
Pro Insight: GE Vernova's economic moat relies on installed-base captivity and high switching costs, not platform network effects. While the 59,000-turbine base locks in lucrative services for Gas Power and Electrification, the Wind segment remains an unproven pillar that continues to dilute portfolio returns.
Competitive advantages are only as credible as the financial results they produce. For GE Vernova, evidence of an economic moat appears most clearly in Power segment margins and pricing power. In Q2 2026, the Power division delivered an adjusted EBITDA margin of 18.8%, according to the Q2 2026 earnings call transcript. This margin expansion demonstrates that management is converting severe industry capacity constraints into genuine bottom-line gains.
Pricing power provides the clearest proof of customer captivity. In its Q2 2026 results webcast, management noted that first-half 2026 equipment orders were priced more than 20% higher than Q4 2025 bookings. Utilities are willing to absorb steep price increases to lock in scarce manufacturing slots, proving that GE Vernova possesses tangible bargaining leverage in power equipment.
Yet the expected benefits of this moat remain uneven across the broader portfolio. The Wind segment remains an unprofitable drag, lacking the steady pricing gains and high aftermarket service margins seen in thermal power. That division dilutes overall consolidated returns on capital.
This dynamic creates an analytical tension for investors. Today's profit surge reflects disciplined commercial execution, but it also rides a strong power infrastructure cycle. Whether these higher backlog margins persist once manufacturing bottlenecks ease remains the ultimate test of GE Vernova's economic moat.
We judge GE Vernova's economic moat trend to be widening. The company's competitive position is expanding across conventional power and grid systems as load growth from artificial intelligence data centers, manufacturing reshoring, and broad electrification accelerates delivery lead times.
Scarcity in production capacity is shifting pricing power directly toward established turbine makers. Customers are no longer waiting until final investment decisions to procure equipment; they are actively securing early factory slots. According to GE Vernova's multi-year outlook update, management raised its 2028 adjusted EBITDA margin target to 20%, up from its previous 14% expectation. That revision reflects growing confidence that recent commercial pricing gains represent structural improvements rather than a transient burst.
The clearest operational evidence of this widening trend sits in Gas Power equipment bookings. Slot reservations and firm equipment backlog expanded from 83 gigawatts before 2026 to 100 GW in Q1, reached 116 GW by Q2, and management expects at least 125 GW by year-end 2026. This dynamic locks in high-visibility demand through the end of the decade, making it exceptionally difficult for rivals to displace GE Vernova in heavy dispatchable power.
Still, the trend remains mixed across segments. Wind continues to face execution hurdles and lower margins, preventing a wider across-the-board moat expansion. To evaluate whether GE Vernova's moat is truly widening or merely experiencing a cyclical boom, investors should monitor four key operational signposts on watchlists:
We assign GE Vernova a medium uncertainty rating. While long-term visibility has improved considerably compared to prior years, the plausible range of business outcomes over the next three to five years remains moderately wide.
Three operational and market realities shape this uncertainty profile:
This range of outcomes directly affects moat durability. If management delivers on its raised 2028 target of 20% adjusted EBITDA margins, GE Vernova will demonstrate that its competitive advantage is structural. Conversely, conversion stumbles or a demand downcycle would indicate that recent gains were mostly cyclical.
Our assessment concludes that GE Vernova possesses a narrow economic moat, a widening moat trend, and a medium uncertainty rating. The foundation of this competitive advantage rests on strong switching costs from its massive installed base, rapid backlog growth to $176 billion, first-half equipment pricing gains of over 20%, and Power segment EBITDA margins of 18.8%.
From here, long-term investors should track two critical issues:
Flawless operational execution and steady backlog conversion toward the $200 billion target, paired with hitting the 20% margin target by 2028, would build a compelling case for a wide moat upgrade. However, project delivery delays, margin compression, or order cancellations would prove that current economics remain tethered to the power cycle.
This content is for informational or educational purposes and is not investment advice.