
Aug 14, 2026
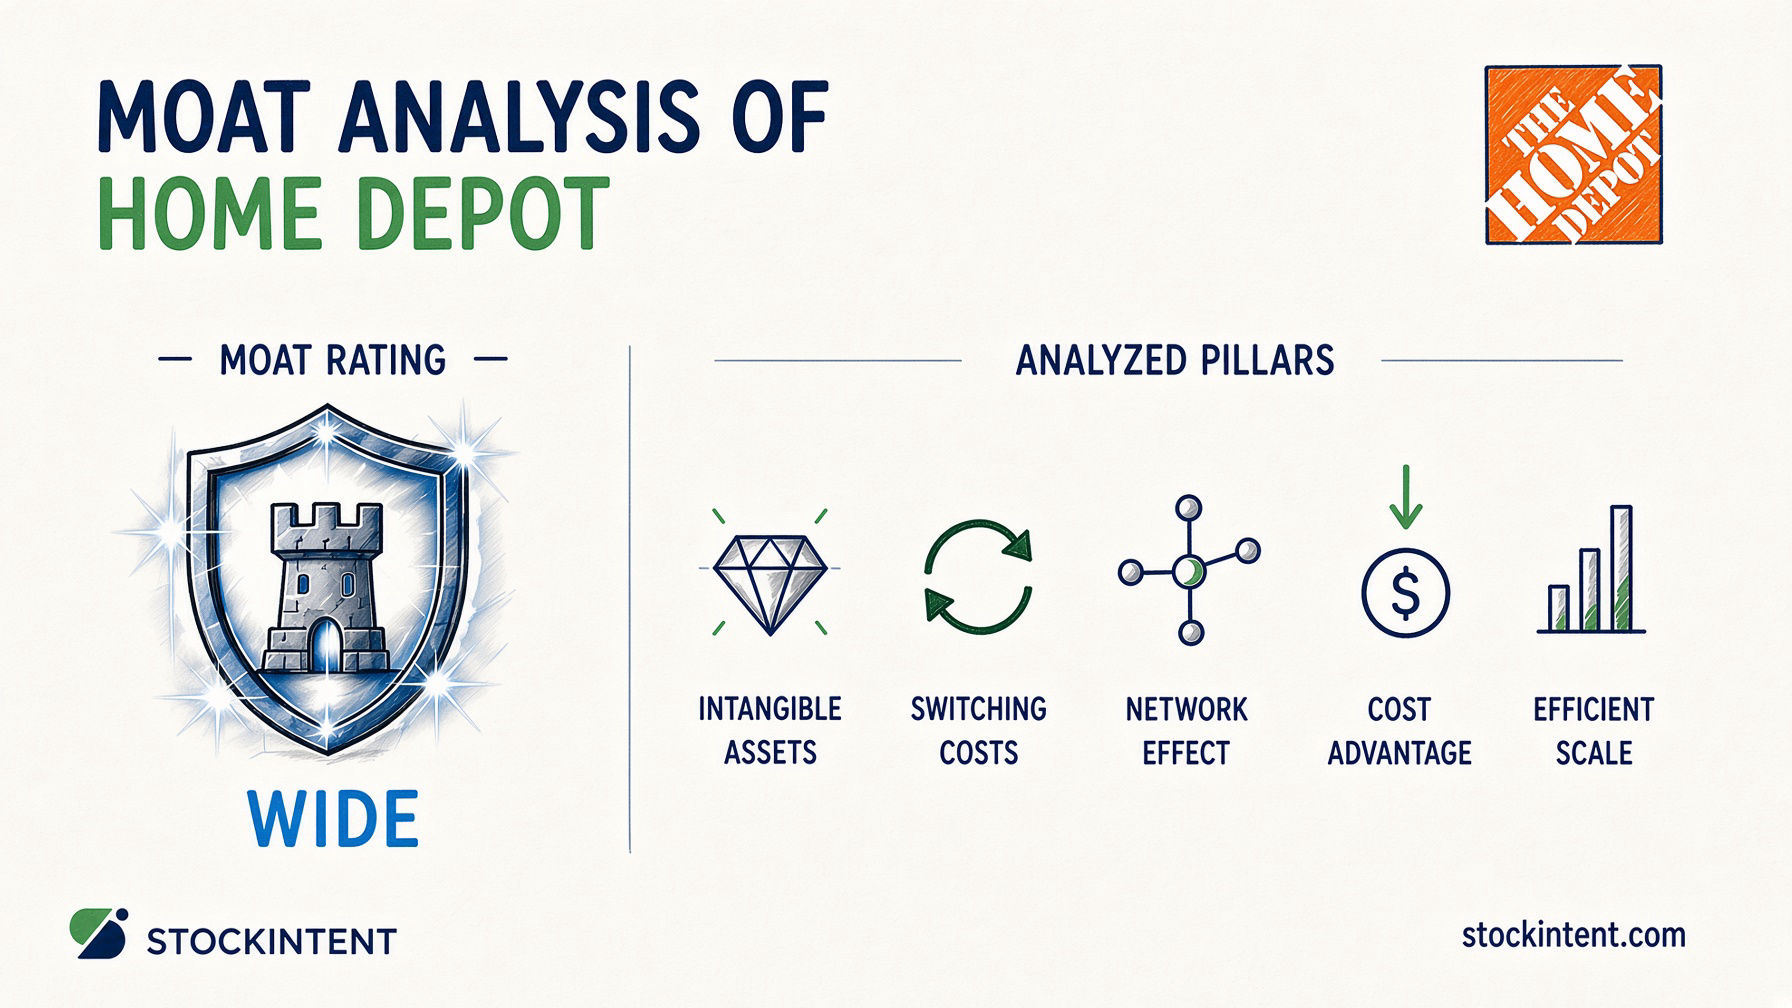
Home Depot carries a wide economic moat with a stable trend and medium uncertainty. Our analysis assigns this verdict based on two durable advantages: economies of scale from a massive store network and brand equity that stabilizes demand through housing cycles.
Here's what matters most:
This article is a business quality assessment, not a stock buy recommendation. A wide moat tells you something about durability, not timing or valuation.
Home Depot's wide moat rests on two pillars that genuinely matter, two that are weak, and one that sits somewhere in between. We'll walk through each of the five moat pillars in order of strength, because not every pillar deserves equal attention.
Cost Advantage (Strong)
This is the bedrock. Morningstar explicitly ties Home Depot's wide moat to economies of scale, and the numbers explain why. The company operates over 2,300 stores located within 10 miles of approximately 90% of the U.S. population. That density creates procurement power, supply-chain efficiency, and last-mile logistics that smaller competitors simply cannot replicate. Scale shows up in pricing, inventory turns, and the ability to absorb fixed costs across a massive revenue base.
Intangible Assets / Brand (Moderate to Strong)
Morningstar identifies brand equity as a core moat source, noting that strong brand recognition helps stabilize sales through housing cycles and supports incremental market share gains. In a market where contractors and homeowners alike need reliability, the orange logo carries weight. Brand doesn't lock customers in, but it reduces friction in the purchase decision, especially during downturns when trust matters more than price.
Efficient Scale (Moderate)
Here's where it gets nuanced. Home Depot holds roughly 15% market share in a $1.1 trillion North American home improvement market. That's massive in absolute terms, but the market remains highly fragmented. Morningstar characterizes efficient scale as "moderate at best" because the market structure doesn't fit the classic narrow oligopoly where one or two players naturally dominate. Home Depot benefits from scale, but competitive threats from specialty distributors and regional players persist.
Switching Costs (Weak for DIY, Meaningful for Pros)
For the typical homeowner, switching costs are minimal. Convenience and habit drive retention, not structural lock-in. Morningstar describes this as "weak" for the consumer segment, with customer retention driven by friction reduction rather than captive relationships.
But the Pro segment tells a different story. Flash Research notes that professional contractors face meaningful workflow integration through trade credit, CRM systems, billing, delivery scheduling, and tax record integration. These aren't theoretical switching costs. They're embedded in how contractors run their businesses.
Pro Insight: In our analysis of retail moats, we distinguish between consumer convenience and true switching costs. Home Depot's DIY customers face minimal friction to shop elsewhere, but professional contractors face meaningful workflow integration costs through trade credit, tax record systems, and job-site delivery logistics.
Network Effects (Not Material)
This one is straightforward. Morningstar characterizes network effects as "weak to not material" for Home Depot. We agree. A retailer's customers don't create direct value for each other in the way that platform users do. More shoppers at Home Depot doesn't make the store inherently more valuable to the next shopper. This pillar simply doesn't apply.
Putting It Together
The moat profile is lopsided in a good way. Cost advantage and brand do the heavy lifting. Pro switching costs offer a potential expansion vector. Efficient scale provides a partial buffer. The weak pillars don't undermine the overall assessment, but they do clarify where Home Depot is vulnerable and where management is wisely investing to strengthen the structure.
For investors who want to translate these moat criteria into measurable screening rules, StockIntent's screener covers 4,000+ metrics including ROIC, margins, and revenue expansion trends to help identify durable compounders with similar competitive profiles.
A wide moat is only as good as the excess returns it produces. For Home Depot, the evidence shows up in three places: market share gains, resilient profitability, and returns on invested capital that consistently clear the cost of capital.
Over the past decade, Home Depot's sales growth has outpaced the building materials and garden supplies dealer industry by roughly 230 basis points annually, according to Morningstar. We see this as a sign of a sustained pattern - taking share in a fragmented market, and it points directly to the scale and brand advantages we discussed above.
The profitability picture is equally telling. Management's fiscal 2026 guidance calls for an adjusted operating margin of 12.8% to 13.0%. For a retailer of Home Depot's size, that's a strong number. It reflects the pricing power and cost discipline that come with operating over 2,300 stores. Morningstar expects ROIC to remain above Home Depot's 7% weighted average cost of capital over the long term, which is the core test of whether a moat actually creates economic value.
But here's where we also need to discuss about the limits of the moat. The moat doesn't eliminate cyclicality. In fiscal 2025, net sales grew 3.2% while operating income declined 3% and net earnings fell 4.4%. The structural advantages were still there. They just couldn't overcome weaker demand for large discretionary projects and pressured consumer spending.
The clearest current manifestation of moat benefits is actually in the Pro segment. Morningstar highlights that professional sales are expected to grow at mid-single-digit organic rates in fiscal 2026, outpacing DIY. That's the workflow integration we talked about earlier showing up in actual business results. When your best customers are growing faster than the rest of the business, it's a signal that something structural is working.
Home Depot's moat trend is stable to modestly widening. The widening isn't coming from a booming housing market. It's coming from deliberate strategy. Management is embedding professional contractors deeper into the company's workflow while expanding digital capabilities that competitors will struggle to match at similar scale.
What the widening forces look like
Professional sales are growing at mid-single-digit organic rates in fiscal 2026, according to Morningstar. That outpaces DIY. Meanwhile, online sales rose more than 10% for the fourth consecutive quarter in Q1 FY2026, per Yahoo Finance. These aren't vanity metrics. They show the Pro ecosystem strategy converting into actual business momentum.
The acquisitions tell the same story. Mingledorff's and the SRS Distribution platform aren't just revenue additions. They're workflow integrations. When a contractor's trade credit, delivery scheduling, and tax records run through Home Depot systems, switching becomes genuinely disruptive to their business operations.
What to watch: a 4-indicator framework
That said, the above points are still playing out and need time to have a significant impact in the overall mix. Therefore, a continuous monitoring of key performance indicators is required.
We recommend value investors to look out for the following:
| Indicator | Why it matters | What to look for |
|---|---|---|
| Pro vs. DIY sales growth mix | Pro customers carry higher switching costs and lifetime value | Sustained Pro outperformance; Pro share of total revenue trending up |
| Comparable sales trajectory | Base case vs. recovery case spread shows demand sensitivity | Comps holding flat to 2% in soft conditions; moving toward 4-5% if housing recovers |
| Operating margin expansion post-investment | Tests whether reinvestment is converting to pricing power or just maintaining share | Margins expanding after Pro/digital investments plateau; not compressing |
| Market share in specialty categories | Roofing, HVAC, and building materials are harder to replicate than commodity DIY | Measurable gains in SRS-integrated categories; not just total market share |
For investors who want to organize these indicators into ongoing monitoring, StockIntent's watchlist lets you track custom metric views across companies and time periods.
The risk to this trend isn't competitive disruption. It's execution failure. If Home Depot cannot integrate SRS effectively, or if Pro growth stalls while DIY keeps weakening, the modest widening could flatten into mere stability. The 10-year share gain trend discussed earlier gives management credibility, but credibility isn't the same as guaranteed execution.
We rate Home Depot's moat with medium uncertainty. The competitive structure is durable, but the range of near-term financial outcomes is wide enough that investors should expect meaningful variation in earnings and growth depending on macro conditions.
The clearest evidence of this range sits right in management's own guidance. Home Depot's fiscal 2026 outlook presents two scenarios: a base case with comparable sales growth of flat to 2%, and a market recovery case with 4% to 5% comparable sales growth. That's roughly 400 basis points of swing driven by housing turnover, interest rates, and consumer remodeling confidence. Reuters reported the initial outlook came in below some analyst estimates, reinforcing that management sees demand staying soft longer than the market had priced in.
Two drivers explain the medium rating. First, cyclical demand variability. Home improvement is tied to housing affordability, mortgage rates, and discretionary spending. DBS Research identifies higher-for-longer interest rates and weaker large discretionary projects as key risks that could pressure guidance even if execution stays solid. Second, financial leverage sensitivity. Home Depot guided to fiscal 2026 net interest expense of approximately $2.3 billion. That's a real earnings headwind if rates stay elevated, and it narrows the margin for error if demand softens further.
From our experience following cyclical retail businesses, we view Home Depot's medium uncertainty as reflecting the gap between structural moat durability and cyclical earnings volatility. The wide moat protects market position during downturns, but the range of ROIC outcomes over the next 3-5 years will depend heavily on whether housing turnover normalizes and the Fed's interest rate trajectory enables refinancing activity to recover.
The uncertainty here is about earnings conversion, not structural erosion. Home Depot's scale, brand, and Pro ecosystem aren't going anywhere. But the timing and magnitude of the returns they generate? That remains genuinely uncertain. For long-term investors, this means the moat assessment holds, but patience and scenario planning matter more than precision forecasting.
Home Depot earns a wide economic moat, a stable to modestly widening trend, and medium uncertainty.
The moat is real. Scale advantages from over 2,300 stores, brand equity that stabilizes demand through cycles, and a Pro ecosystem that deepens contractor relationships give Home Depot structural defenses that smaller rivals cannot easily replicate. These advantages show up in 230 basis points of annual sales outperformance versus the industry over a decade, adjusted operating margins guided to 12.8% to 13.0% for fiscal 2026, and professional sales growing at mid-single-digit organic rates while DIY lags.
But two issues matter most from here. First, execution of Pro ecosystem integration. The SRS and GMS acquisitions need to convert from revenue additions to genuine workflow embedding. If contractors' trade credit, delivery logistics, and tax records run through Home Depot systems, switching costs widen from weak to meaningful. If integration stalls, the modest widening flattens to stability. Second, housing cycle normalization. The moat protects market position during downturns, but it cannot force homeowners to renovate when mortgage rates stay elevated. The 400-basis-point spread between base case and recovery case comparable sales guidance captures this uncertainty precisely.
The structural advantages are durable. The timing of their financial payoff is not. For long-term investors, this means monitoring the four-indicator framework we outlined above matters more than predicting the next quarter. The moat assessment holds; the earnings path remains uncertain.
This content is for informational purposes only and is not investment advice.
Home Depot carries a wide economic moat with a stable trend and medium uncertainty. Our analysis assigns this verdict based on two durable advantages: economies of scale from a massive store network and brand equity that stabilizes demand through housing cycles.
Here's what matters most:
This article is a business quality assessment, not a stock buy recommendation. A wide moat tells you something about durability, not timing or valuation.
Home Depot's wide moat rests on two pillars that genuinely matter, two that are weak, and one that sits somewhere in between. We'll walk through each of the five moat pillars in order of strength, because not every pillar deserves equal attention.
Cost Advantage (Strong)
This is the bedrock. Morningstar explicitly ties Home Depot's wide moat to economies of scale, and the numbers explain why. The company operates over 2,300 stores located within 10 miles of approximately 90% of the U.S. population. That density creates procurement power, supply-chain efficiency, and last-mile logistics that smaller competitors simply cannot replicate. Scale shows up in pricing, inventory turns, and the ability to absorb fixed costs across a massive revenue base.
Intangible Assets / Brand (Moderate to Strong)
Morningstar identifies brand equity as a core moat source, noting that strong brand recognition helps stabilize sales through housing cycles and supports incremental market share gains. In a market where contractors and homeowners alike need reliability, the orange logo carries weight. Brand doesn't lock customers in, but it reduces friction in the purchase decision, especially during downturns when trust matters more than price.
Efficient Scale (Moderate)
Here's where it gets nuanced. Home Depot holds roughly 15% market share in a $1.1 trillion North American home improvement market. That's massive in absolute terms, but the market remains highly fragmented. Morningstar characterizes efficient scale as "moderate at best" because the market structure doesn't fit the classic narrow oligopoly where one or two players naturally dominate. Home Depot benefits from scale, but competitive threats from specialty distributors and regional players persist.
Switching Costs (Weak for DIY, Meaningful for Pros)
For the typical homeowner, switching costs are minimal. Convenience and habit drive retention, not structural lock-in. Morningstar describes this as "weak" for the consumer segment, with customer retention driven by friction reduction rather than captive relationships.
But the Pro segment tells a different story. Flash Research notes that professional contractors face meaningful workflow integration through trade credit, CRM systems, billing, delivery scheduling, and tax record integration. These aren't theoretical switching costs. They're embedded in how contractors run their businesses.
Pro Insight: In our analysis of retail moats, we distinguish between consumer convenience and true switching costs. Home Depot's DIY customers face minimal friction to shop elsewhere, but professional contractors face meaningful workflow integration costs through trade credit, tax record systems, and job-site delivery logistics.
Network Effects (Not Material)
This one is straightforward. Morningstar characterizes network effects as "weak to not material" for Home Depot. We agree. A retailer's customers don't create direct value for each other in the way that platform users do. More shoppers at Home Depot doesn't make the store inherently more valuable to the next shopper. This pillar simply doesn't apply.
Putting It Together
The moat profile is lopsided in a good way. Cost advantage and brand do the heavy lifting. Pro switching costs offer a potential expansion vector. Efficient scale provides a partial buffer. The weak pillars don't undermine the overall assessment, but they do clarify where Home Depot is vulnerable and where management is wisely investing to strengthen the structure.
For investors who want to translate these moat criteria into measurable screening rules, StockIntent's screener covers 4,000+ metrics including ROIC, margins, and revenue expansion trends to help identify durable compounders with similar competitive profiles.
A wide moat is only as good as the excess returns it produces. For Home Depot, the evidence shows up in three places: market share gains, resilient profitability, and returns on invested capital that consistently clear the cost of capital.
Over the past decade, Home Depot's sales growth has outpaced the building materials and garden supplies dealer industry by roughly 230 basis points annually, according to Morningstar. We see this as a sign of a sustained pattern - taking share in a fragmented market, and it points directly to the scale and brand advantages we discussed above.
The profitability picture is equally telling. Management's fiscal 2026 guidance calls for an adjusted operating margin of 12.8% to 13.0%. For a retailer of Home Depot's size, that's a strong number. It reflects the pricing power and cost discipline that come with operating over 2,300 stores. Morningstar expects ROIC to remain above Home Depot's 7% weighted average cost of capital over the long term, which is the core test of whether a moat actually creates economic value.
But here's where we also need to discuss about the limits of the moat. The moat doesn't eliminate cyclicality. In fiscal 2025, net sales grew 3.2% while operating income declined 3% and net earnings fell 4.4%. The structural advantages were still there. They just couldn't overcome weaker demand for large discretionary projects and pressured consumer spending.
The clearest current manifestation of moat benefits is actually in the Pro segment. Morningstar highlights that professional sales are expected to grow at mid-single-digit organic rates in fiscal 2026, outpacing DIY. That's the workflow integration we talked about earlier showing up in actual business results. When your best customers are growing faster than the rest of the business, it's a signal that something structural is working.
Home Depot's moat trend is stable to modestly widening. The widening isn't coming from a booming housing market. It's coming from deliberate strategy. Management is embedding professional contractors deeper into the company's workflow while expanding digital capabilities that competitors will struggle to match at similar scale.
What the widening forces look like
Professional sales are growing at mid-single-digit organic rates in fiscal 2026, according to Morningstar. That outpaces DIY. Meanwhile, online sales rose more than 10% for the fourth consecutive quarter in Q1 FY2026, per Yahoo Finance. These aren't vanity metrics. They show the Pro ecosystem strategy converting into actual business momentum.
The acquisitions tell the same story. Mingledorff's and the SRS Distribution platform aren't just revenue additions. They're workflow integrations. When a contractor's trade credit, delivery scheduling, and tax records run through Home Depot systems, switching becomes genuinely disruptive to their business operations.
What to watch: a 4-indicator framework
That said, the above points are still playing out and need time to have a significant impact in the overall mix. Therefore, a continuous monitoring of key performance indicators is required.
We recommend value investors to look out for the following:
| Indicator | Why it matters | What to look for |
|---|---|---|
| Pro vs. DIY sales growth mix | Pro customers carry higher switching costs and lifetime value | Sustained Pro outperformance; Pro share of total revenue trending up |
| Comparable sales trajectory | Base case vs. recovery case spread shows demand sensitivity | Comps holding flat to 2% in soft conditions; moving toward 4-5% if housing recovers |
| Operating margin expansion post-investment | Tests whether reinvestment is converting to pricing power or just maintaining share | Margins expanding after Pro/digital investments plateau; not compressing |
| Market share in specialty categories | Roofing, HVAC, and building materials are harder to replicate than commodity DIY | Measurable gains in SRS-integrated categories; not just total market share |
For investors who want to organize these indicators into ongoing monitoring, StockIntent's watchlist lets you track custom metric views across companies and time periods.
The risk to this trend isn't competitive disruption. It's execution failure. If Home Depot cannot integrate SRS effectively, or if Pro growth stalls while DIY keeps weakening, the modest widening could flatten into mere stability. The 10-year share gain trend discussed earlier gives management credibility, but credibility isn't the same as guaranteed execution.
We rate Home Depot's moat with medium uncertainty. The competitive structure is durable, but the range of near-term financial outcomes is wide enough that investors should expect meaningful variation in earnings and growth depending on macro conditions.
The clearest evidence of this range sits right in management's own guidance. Home Depot's fiscal 2026 outlook presents two scenarios: a base case with comparable sales growth of flat to 2%, and a market recovery case with 4% to 5% comparable sales growth. That's roughly 400 basis points of swing driven by housing turnover, interest rates, and consumer remodeling confidence. Reuters reported the initial outlook came in below some analyst estimates, reinforcing that management sees demand staying soft longer than the market had priced in.
Two drivers explain the medium rating. First, cyclical demand variability. Home improvement is tied to housing affordability, mortgage rates, and discretionary spending. DBS Research identifies higher-for-longer interest rates and weaker large discretionary projects as key risks that could pressure guidance even if execution stays solid. Second, financial leverage sensitivity. Home Depot guided to fiscal 2026 net interest expense of approximately $2.3 billion. That's a real earnings headwind if rates stay elevated, and it narrows the margin for error if demand softens further.
From our experience following cyclical retail businesses, we view Home Depot's medium uncertainty as reflecting the gap between structural moat durability and cyclical earnings volatility. The wide moat protects market position during downturns, but the range of ROIC outcomes over the next 3-5 years will depend heavily on whether housing turnover normalizes and the Fed's interest rate trajectory enables refinancing activity to recover.
The uncertainty here is about earnings conversion, not structural erosion. Home Depot's scale, brand, and Pro ecosystem aren't going anywhere. But the timing and magnitude of the returns they generate? That remains genuinely uncertain. For long-term investors, this means the moat assessment holds, but patience and scenario planning matter more than precision forecasting.
Home Depot earns a wide economic moat, a stable to modestly widening trend, and medium uncertainty.
The moat is real. Scale advantages from over 2,300 stores, brand equity that stabilizes demand through cycles, and a Pro ecosystem that deepens contractor relationships give Home Depot structural defenses that smaller rivals cannot easily replicate. These advantages show up in 230 basis points of annual sales outperformance versus the industry over a decade, adjusted operating margins guided to 12.8% to 13.0% for fiscal 2026, and professional sales growing at mid-single-digit organic rates while DIY lags.
But two issues matter most from here. First, execution of Pro ecosystem integration. The SRS and GMS acquisitions need to convert from revenue additions to genuine workflow embedding. If contractors' trade credit, delivery logistics, and tax records run through Home Depot systems, switching costs widen from weak to meaningful. If integration stalls, the modest widening flattens to stability. Second, housing cycle normalization. The moat protects market position during downturns, but it cannot force homeowners to renovate when mortgage rates stay elevated. The 400-basis-point spread between base case and recovery case comparable sales guidance captures this uncertainty precisely.
The structural advantages are durable. The timing of their financial payoff is not. For long-term investors, this means monitoring the four-indicator framework we outlined above matters more than predicting the next quarter. The moat assessment holds; the earnings path remains uncertain.
This content is for informational purposes only and is not investment advice.