A stock can look cheap without being undervalued. The real task is to separate low prices from genuine mispricing by combining screening, business-quality checks, normalized fundamentals, intrinsic-value analysis, and a margin of safety.
Finding an undervalued stock sounds simple: look for a low valuation multiple, compare it with peers, and buy when the price looks cheap. In practice, that approach can confuse a low price with a low-quality business, a cyclical earnings peak, temporary cash flow, or a balance sheet that deserves a discount.
A more useful definition is stricter: a stock is undervalued when its market price sits meaningfully below a defensible range of intrinsic value, after accounting for the economics of the business, the quality of its financials, the assumptions inside the valuation, and the uncertainty around those assumptions.
The key distinction: screening tells you where to look; valuation helps you decide whether the apparent discount is real.
The framework below is designed to move from a large investment universe to a smaller set of companies that deserve deeper work. The aim is to make the research process more disciplined, explicit, and repeatable.
The market price of a stock is observable. Intrinsic value is not. Intrinsic value is an estimate of what the underlying business may be worth based on future cash-generation capacity, reinvestment needs, growth, profitability, risk, and capital structure.
That makes undervaluation a relationship between two different things: a known market price and an uncertain estimate. A useful working definition is:
Potential undervaluation = Market price below a defensible intrinsic-value range, with enough margin to absorb estimation error.
This definition immediately eliminates a common mistake: assuming that a low P/E, low price-to-book ratio, or high free-cash-flow yield is proof of undervaluation. Those metrics are clues. They are not conclusions.
| Signal | What it can tell you | What it cannot tell you |
|---|---|---|
| Low P/E | The stock trades at a low price relative to reported earnings. | Whether earnings are sustainable, normalized, or high-quality. |
| High free-cash-flow yield | Current cash generation is high relative to the market value. | Whether cash flow is temporarily inflated or requires unusually low reinvestment. |
| Low price-to-book | The market values the company near or below accounting book value. | Whether the assets can earn attractive returns or deserve their carrying value. |
| Discount to a DCF estimate | The market price is below the output of a cash-flow model. | Whether the growth, margin, discount-rate, and terminal assumptions are reasonable. |
Deep valuation work takes time. A market-wide screen should therefore do one job well: reduce thousands of securities to a manageable shortlist of candidates that deserve further research.
Traditional screens often start with valuation multiples such as P/E, EV/EBITDA, price-to-sales, or free-cash-flow yield. Those filters are useful, but they become more informative when combined with measures of business quality and financial health.
An intrinsic-value screen takes the process one step further by comparing market prices with estimated fair values across a broad universe, then allowing the investor to layer fundamental filters on top of that valuation gap.
We recommend a screener built for value investing. The StockIntent stock screener ranks each stock against its sector and its own history, not just raw numbers. That lets you spot great businesses while their price is down: the fundamentals still hold up, but the stock trades cheaper than usual. It is the old rule of buying low, applied to quality companies. The screen below keeps companies in the top 20% for sales growth that trade in the cheapest 30% of their own P/E history.

If you want a second, independent option, ValuEdge’s intrinsic value screener is built around a related workflow: use estimated fair value and margin of safety as discovery variables, then narrow the results with additional fundamental criteria.
The important point is not to treat the screen as a verdict. A screen produces candidates; the next steps determine whether the discount is justified.
A value trap is a company that appears statistically cheap but is cheap for reasons that undermine the investment thesis. The objective is not to avoid every troubled company. It is to understand whether the apparent discount is compensation for temporary uncertainty or a reflection of deteriorating economics.
Earnings quality. Are reported profits supported by cash flow, or are they heavily influenced by accruals, one-time items, working-capital swings, or accounting adjustments?
Balance-sheet risk. Could debt, refinancing needs, pension obligations, or other claims consume the equity value before the thesis has time to work?
Economic durability. Are margins and returns on capital stable because the business has structural advantages, or are they temporarily elevated by a favorable cycle?
Reinvestment requirements. Does growth create value after the capital required to fund it, or does the business need increasing investment merely to maintain its position?
Shareholder dilution. Is per-share value growing, or is operating progress being offset by persistent issuance, stock-based compensation, or acquisitions funded with equity?
If the answer to these questions is unclear, the correct response is not to force a precise valuation. Uncertainty should widen the valuation range, lower confidence, or remove the company from the shortlist.
One of the easiest ways to overestimate intrinsic value is to capitalize an abnormal year. This is especially dangerous in cyclical businesses, commodity producers, financial companies, turnarounds, and companies benefiting from temporary pricing power.
Instead of asking, “What did the company earn last year?” ask, “What level of revenue, margin, reinvestment, and cash generation is sustainable across a normal business environment?”
The purpose is not to smooth away bad news. It is to avoid valuing a business as if an unusually strong or weak period will continue forever.
Value investing tools like StockIntent do much of this work for you. They average out margins, capital spending (capex) and returns on capital over several years. They also let you rank metrics like P/E, cash return on invested capital and margins against the company’s own history. That shows you if last year was a one-time outlier or part of a longer trend.
Once a company survives the screening and quality checks, the analysis shifts from discovery to valuation. At this stage, the question is no longer “Does this stock look cheap?” but “What would this business be worth under reasonable assumptions?”
For many operating companies, a discounted cash-flow framework is useful because it forces the investor to make the main assumptions explicit: future revenue, operating profitability, reinvestment, cash conversion, discount rate, and terminal economics.
But no single model fits every security. Banks, insurers, asset-heavy businesses, REITs, early-stage companies, and firms with unstable or negative cash flow may require a different framework or a much wider range of outcomes.
A practical workflow is to use an intrinsic value calculator only after the company has passed the earlier checks. The useful output is not a perfectly precise figure; it is a transparent range that can be challenged.
There are two common ways to build that DCF. Business schools teach the WACC model: discount cash flows at the weighted average cost of capital, then add a terminal value that grows forever. We prefer a simpler approach: set the discount rate to the return you want, forecast a few years, and end with a past multiple, like P/E or price to free cash flow. Why? WACC relies on beta and the equity risk premium, which are hard to pin down, and small changes in the forever growth rate swing the result. A past multiple you can check, and your target return you already know.
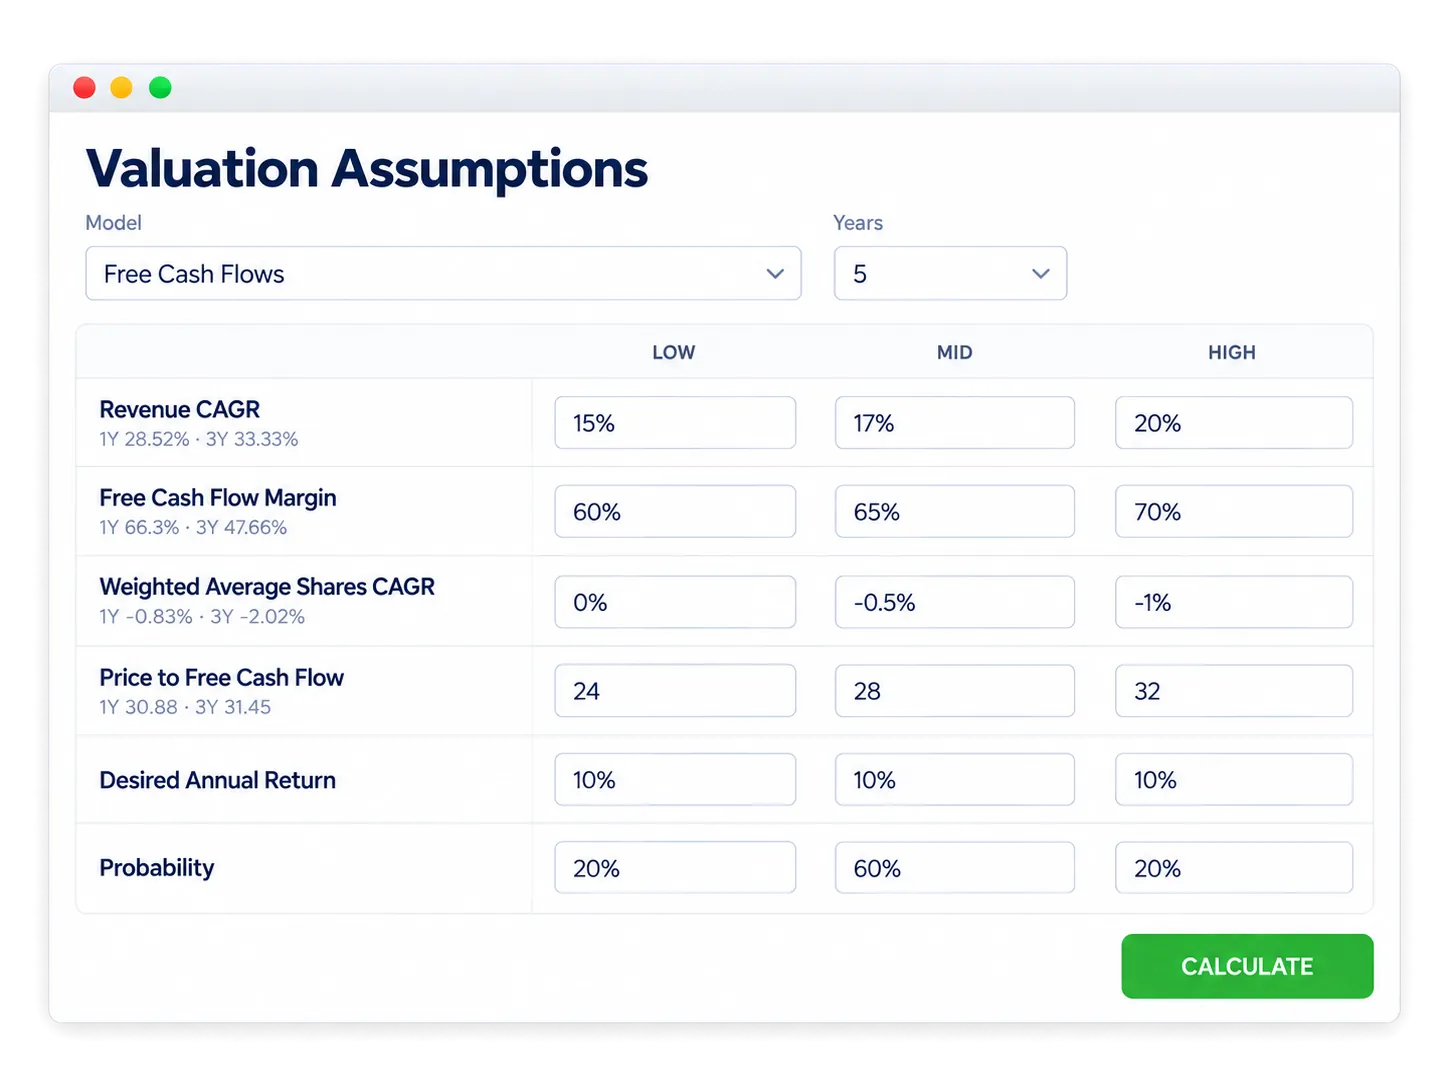
The StockIntent DCF calculator is built around this approach. While you type each assumption, it shows you the company’s one, three, five and ten year history right next to the input. You can see at a glance if last year was an outlier, what the average was, and where a more careful number would sit. This is how the assumptions look in StockIntent, with the history printed under each input.
If you prefer the WACC model, the ValuEdge intrinsic value calculator is designed for single-company analysis, exposing the assumptions behind the estimate and using model-aware valuation logic rather than presenting fair value as an unexplained number.
Growth: What growth rate is being assumed, for how long, and what supports it?
Margins: Are margins expected to expand, contract, or normalize?
Reinvestment: How much capital is required to produce the assumed growth?
Risk: What discount rate do you use? Your own required return, or a WACC that reflects the uncertainty and financing characteristics of the business?
Terminal value: What is the business worth at the end of the forecast? Which exit multiple is assumed and how does it compare with the company’s history, or which long-run growth rate and returns on capital are assumed forever?
Intrinsic value is highly sensitive to assumptions. A model that produces $100 per share under one set of inputs may produce a materially different result if margins normalize faster, growth slows, reinvestment rises, or the discount rate increases.
That is not a flaw in valuation. It is the reason the model should be stress-tested.
If a small change in one assumption destroys the apparent discount, the thesis is fragile. If the stock remains attractive across a reasonable range of assumptions, the valuation is more robust.
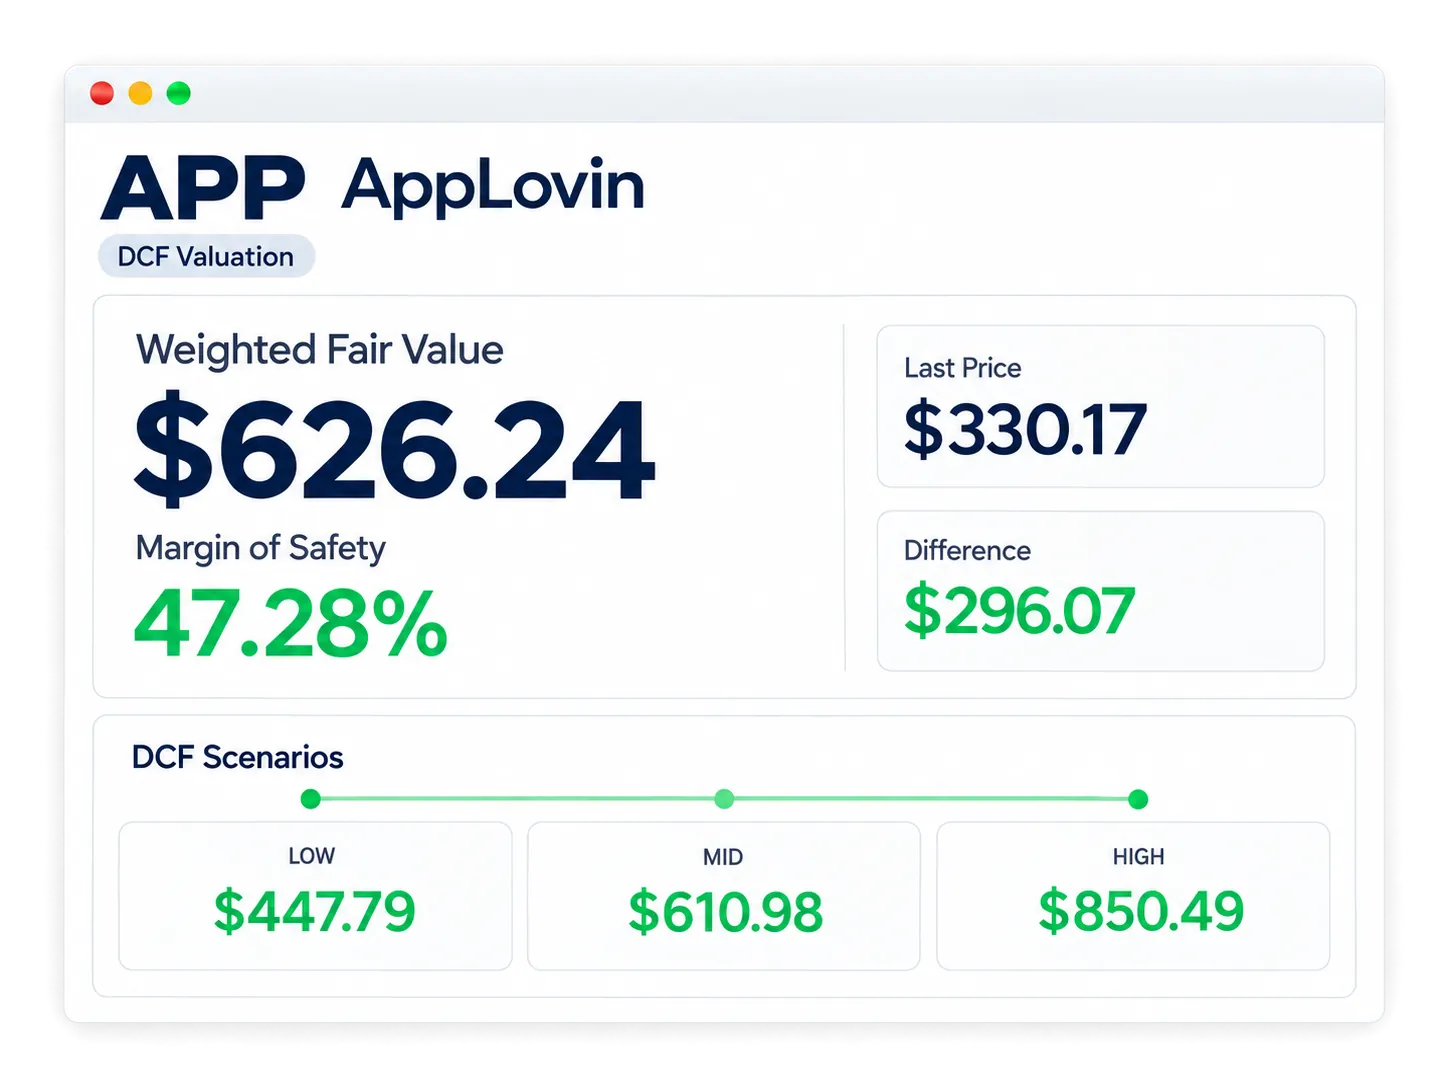
Good DCF tools build this in. The StockIntent DCF calculator has a low, mid and high scenario by default. You enter a careful case and a hopeful case at the same time, and see right away how much the fair value moves. The wider the gap between low and high, the more your result depends on your inputs. Here is the result in StockIntent: a fair value for each scenario, one weighted fair value and the margin of safety against today’s price.
Consider a hypothetical company trading at $24 per share. It earned $2.00 per share over the last twelve months, so the stock trades at 12 times earnings. At first glance, that may look inexpensive.
A deeper review shows that the company is in a cyclical industry. The last twelve months benefited from unusually strong pricing, operating margins are well above their ten-year median, and working-capital releases temporarily lifted free cash flow.
Instead of capitalizing $2.00 of peak earnings, assume normalized earnings are closer to $1.45 per share. The apparent 12× P/E immediately becomes roughly 16.6× normalized earnings.
Suppose a conservative case implies fair value of $20, a base case implies $25, and an optimistic case implies $31. The current $24 market price is not obviously a bargain. It sits close to the center of the range.
If the company must preserve peak margins for the optimistic case to work, the market price may already reflect a favorable outcome. The low trailing P/E did not reveal undervaluation; it reflected temporarily elevated earnings.
Lesson: valuation multiples are most useful when the denominator is economically normal. A cheap-looking ratio can disappear once the underlying fundamentals are normalized.
Because intrinsic value is an estimate, the difference between fair value and market price should compensate for uncertainty. That buffer is the margin of safety.
There is no universal percentage that works for every company. A stable business with predictable cash flows may justify a narrower buffer than a cyclical, leveraged, or rapidly changing business. The required margin should reflect the reliability of the inputs and the range of plausible outcomes.
A useful way to think about margin of safety is not as a target discount but as protection against being wrong. The less certain the business, the model, or the assumptions, the more demanding the investor should be about price.
This is one more reason we like the model where the discount rate is your desired return. If you are unsure about your assumptions, raise the discount rate. The fair value drops, and your margin of safety grows with it. If you are confident, you can use a lower rate. Because your target return is already built in, the model gives you the margin of safety directly, the way the StockIntent DCF calculator shows it next to the last price.
A valuation is a snapshot based on a set of assumptions. Those assumptions can change when a company reports results, raises capital, makes an acquisition, loses a major customer, changes guidance, or experiences a shift in industry economics.
The research process therefore does not end when a fair-value range is calculated. The investor should know which variables matter most to the thesis and what evidence would cause the valuation to be revised.
For one company, that may be gross margin and unit growth. For another, it may be credit losses, reinvestment intensity, regulatory capital, or customer concentration. Monitoring the thesis is more useful than monitoring the stock price alone.
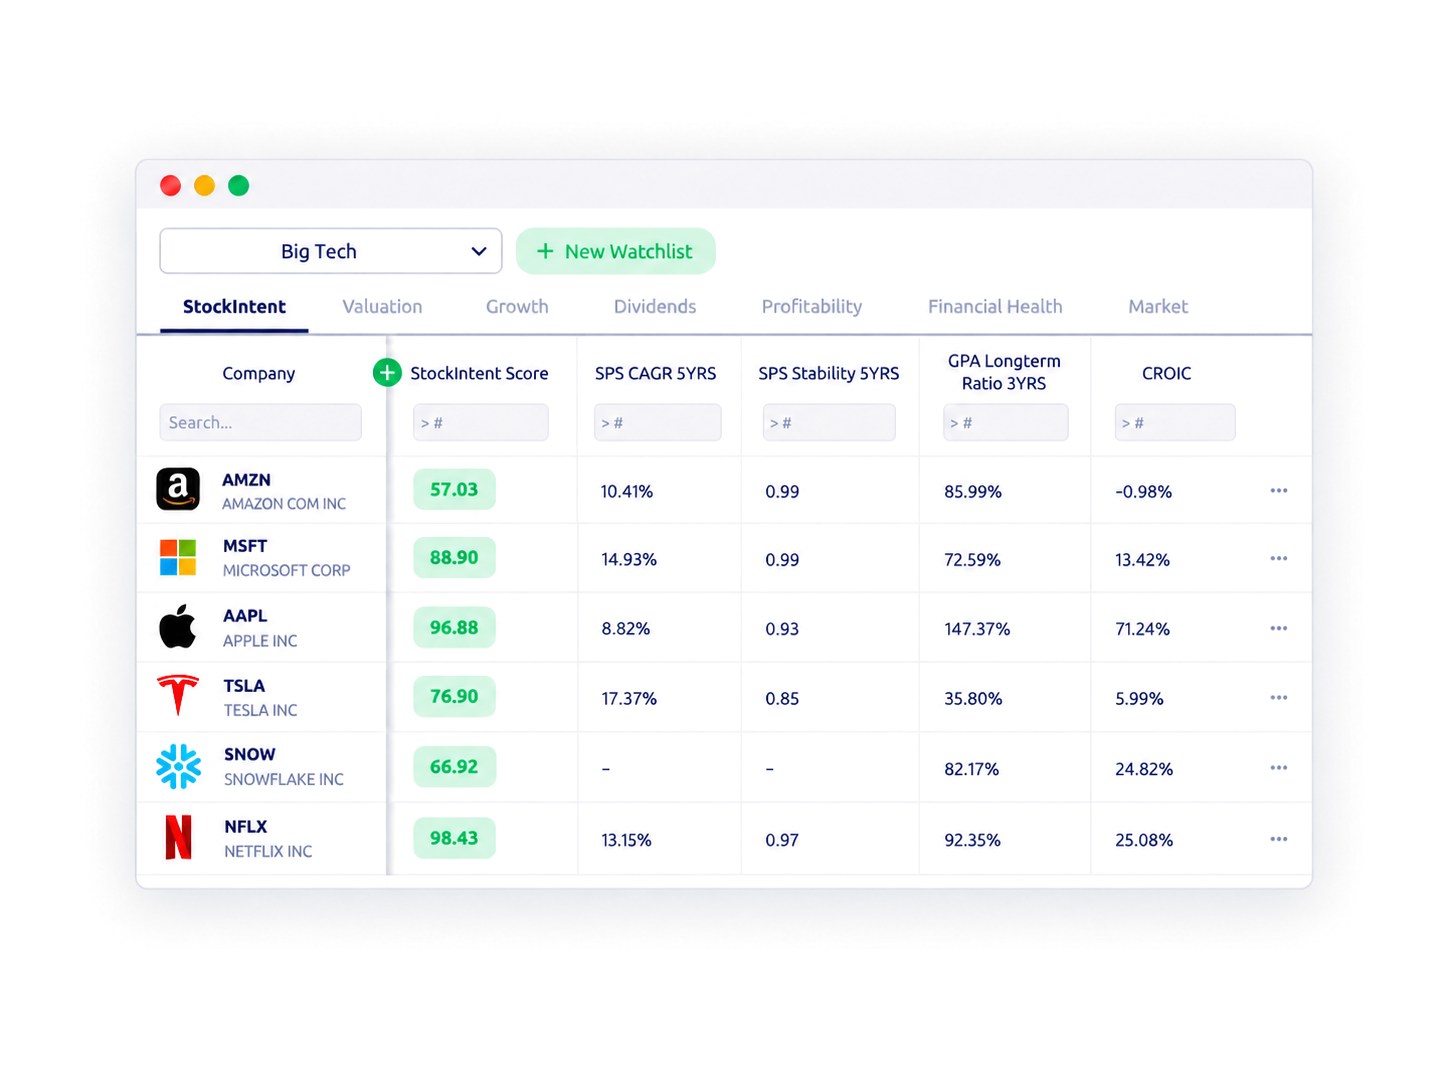
That is why a value investing platform that covers the whole process is worth having. With StockIntent you screen, check quality, value and then track in one place. The StockIntent watchlist shows the metrics behind each thesis for every company you own or follow, so you see when a key number starts to slip. This is a StockIntent watchlist: one row per company, with the Score and your key metrics side by side.
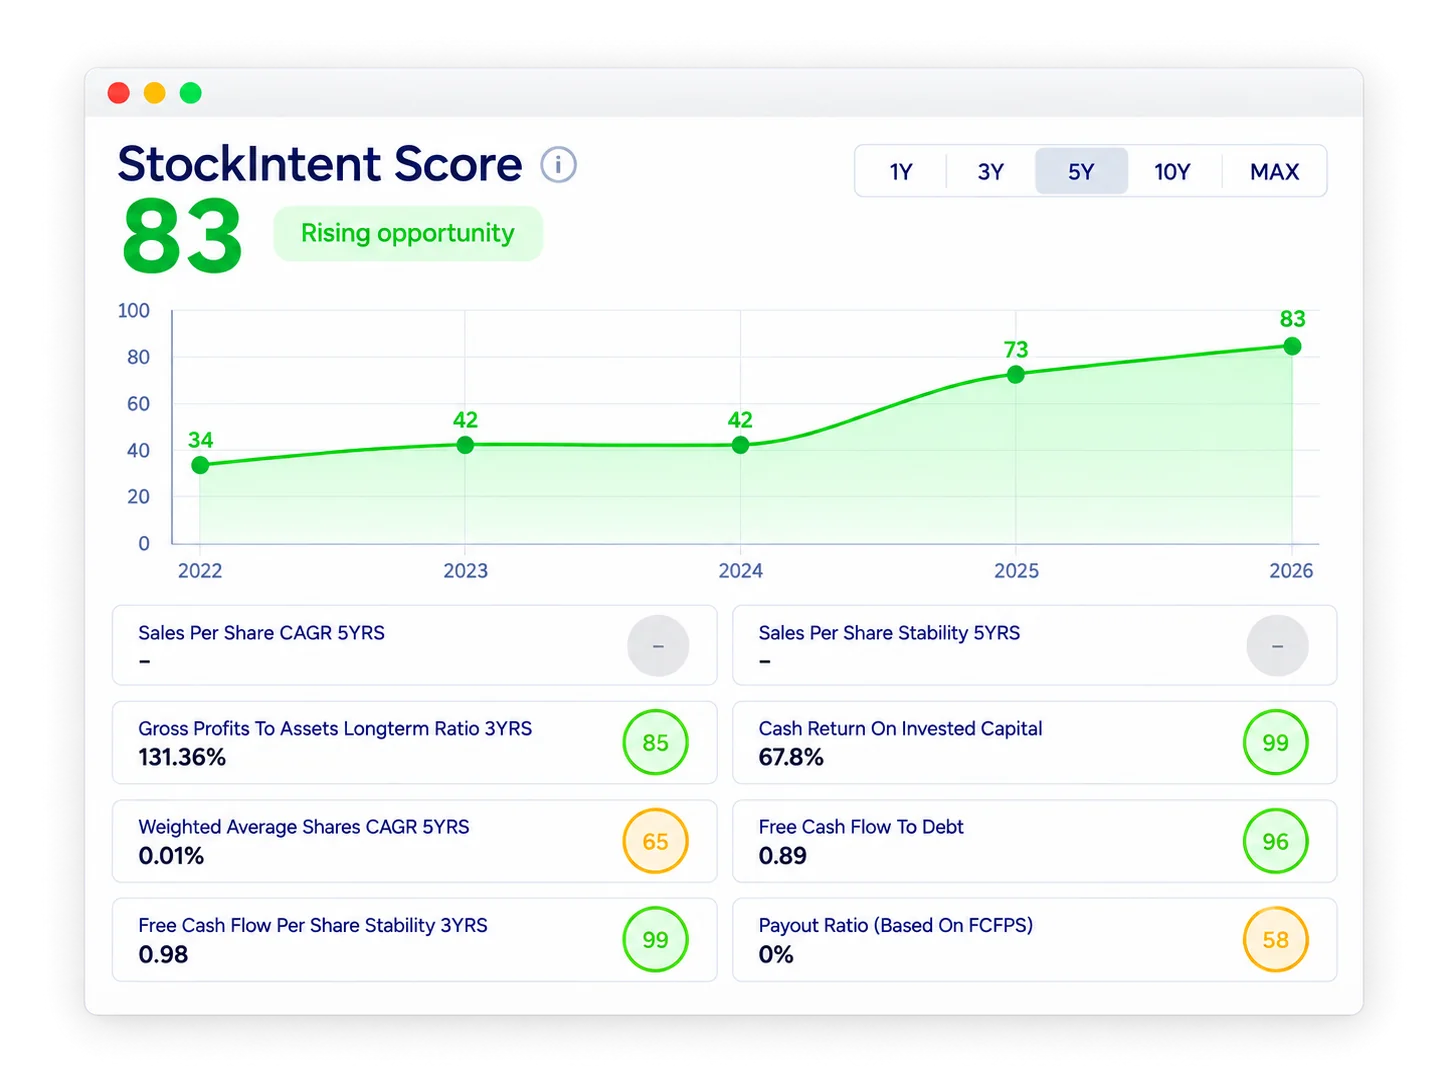
Working through this list for every stock on a shortlist takes time. The StockIntent Score speeds up the first pass. It scores each company from 0 to 100 on eight fundamental metrics, including sales growth and stability, cash return on invested capital, dilution and free cash flow to debt. You can see in seconds which candidates pass the quality questions above and which need a closer look. Here is how the StockIntent Score looks on a company page, with its history and the eight metrics behind it.
A cheap stock trades at a low price relative to a metric such as earnings, book value, or cash flow. An undervalued stock trades below a defensible estimate of intrinsic value. A stock can be cheap because the business is deteriorating, so the two terms should not be treated as synonyms.
Usually, yes. A screen reduces a large universe to a smaller set of candidates that deserve deeper analysis. Running a detailed valuation on every stock is inefficient, while relying only on a screen is too shallow. The two steps solve different problems.
No. A low P/E can reflect temporary peak earnings, high financial risk, weak growth prospects, poor earnings quality, or structural decline. It is better used as a starting signal that requires normalization and further research.
Because valuation depends on assumptions that cannot be known with certainty. A range makes that uncertainty visible and encourages the investor to test how the conclusion changes when growth, margins, reinvestment, or the discount rate changes.
Margin of safety is the buffer between the market price and a reasonable estimate of value. Its purpose is to reduce the cost of estimation error, unexpected events, and overconfidence in the model.
Finding undervalued stocks is not about discovering the lowest multiple on a screen. It is a sequence of progressively harder questions.
Screen for potential mispricing → eliminate value traps → normalize the fundamentals → estimate intrinsic value → stress-test the assumptions → require a margin of safety → monitor the thesis.
The advantage of this process is not that it removes uncertainty. It makes uncertainty visible. A disciplined investor does not need every valuation to be correct; the goal is to avoid confusing a superficially cheap stock with a genuinely undervalued business.
A stock can look cheap without being undervalued. The real task is to separate low prices from genuine mispricing by combining screening, business-quality checks, normalized fundamentals, intrinsic-value analysis, and a margin of safety.
Finding an undervalued stock sounds simple: look for a low valuation multiple, compare it with peers, and buy when the price looks cheap. In practice, that approach can confuse a low price with a low-quality business, a cyclical earnings peak, temporary cash flow, or a balance sheet that deserves a discount.
A more useful definition is stricter: a stock is undervalued when its market price sits meaningfully below a defensible range of intrinsic value, after accounting for the economics of the business, the quality of its financials, the assumptions inside the valuation, and the uncertainty around those assumptions.
The key distinction: screening tells you where to look; valuation helps you decide whether the apparent discount is real.
The framework below is designed to move from a large investment universe to a smaller set of companies that deserve deeper work. The aim is to make the research process more disciplined, explicit, and repeatable.
The market price of a stock is observable. Intrinsic value is not. Intrinsic value is an estimate of what the underlying business may be worth based on future cash-generation capacity, reinvestment needs, growth, profitability, risk, and capital structure.
That makes undervaluation a relationship between two different things: a known market price and an uncertain estimate. A useful working definition is:
Potential undervaluation = Market price below a defensible intrinsic-value range, with enough margin to absorb estimation error.
This definition immediately eliminates a common mistake: assuming that a low P/E, low price-to-book ratio, or high free-cash-flow yield is proof of undervaluation. Those metrics are clues. They are not conclusions.
| Signal | What it can tell you | What it cannot tell you |
|---|---|---|
| Low P/E | The stock trades at a low price relative to reported earnings. | Whether earnings are sustainable, normalized, or high-quality. |
| High free-cash-flow yield | Current cash generation is high relative to the market value. | Whether cash flow is temporarily inflated or requires unusually low reinvestment. |
| Low price-to-book | The market values the company near or below accounting book value. | Whether the assets can earn attractive returns or deserve their carrying value. |
| Discount to a DCF estimate | The market price is below the output of a cash-flow model. | Whether the growth, margin, discount-rate, and terminal assumptions are reasonable. |
Deep valuation work takes time. A market-wide screen should therefore do one job well: reduce thousands of securities to a manageable shortlist of candidates that deserve further research.
Traditional screens often start with valuation multiples such as P/E, EV/EBITDA, price-to-sales, or free-cash-flow yield. Those filters are useful, but they become more informative when combined with measures of business quality and financial health.
An intrinsic-value screen takes the process one step further by comparing market prices with estimated fair values across a broad universe, then allowing the investor to layer fundamental filters on top of that valuation gap.
We recommend a screener built for value investing. The StockIntent stock screener ranks each stock against its sector and its own history, not just raw numbers. That lets you spot great businesses while their price is down: the fundamentals still hold up, but the stock trades cheaper than usual. It is the old rule of buying low, applied to quality companies. The screen below keeps companies in the top 20% for sales growth that trade in the cheapest 30% of their own P/E history.
If you want a second, independent option, ValuEdge’s intrinsic value screener is built around a related workflow: use estimated fair value and margin of safety as discovery variables, then narrow the results with additional fundamental criteria.
The important point is not to treat the screen as a verdict. A screen produces candidates; the next steps determine whether the discount is justified.
A value trap is a company that appears statistically cheap but is cheap for reasons that undermine the investment thesis. The objective is not to avoid every troubled company. It is to understand whether the apparent discount is compensation for temporary uncertainty or a reflection of deteriorating economics.
Earnings quality. Are reported profits supported by cash flow, or are they heavily influenced by accruals, one-time items, working-capital swings, or accounting adjustments?
Balance-sheet risk. Could debt, refinancing needs, pension obligations, or other claims consume the equity value before the thesis has time to work?
Economic durability. Are margins and returns on capital stable because the business has structural advantages, or are they temporarily elevated by a favorable cycle?
Reinvestment requirements. Does growth create value after the capital required to fund it, or does the business need increasing investment merely to maintain its position?
Shareholder dilution. Is per-share value growing, or is operating progress being offset by persistent issuance, stock-based compensation, or acquisitions funded with equity?
If the answer to these questions is unclear, the correct response is not to force a precise valuation. Uncertainty should widen the valuation range, lower confidence, or remove the company from the shortlist.
One of the easiest ways to overestimate intrinsic value is to capitalize an abnormal year. This is especially dangerous in cyclical businesses, commodity producers, financial companies, turnarounds, and companies benefiting from temporary pricing power.
Instead of asking, “What did the company earn last year?” ask, “What level of revenue, margin, reinvestment, and cash generation is sustainable across a normal business environment?”
The purpose is not to smooth away bad news. It is to avoid valuing a business as if an unusually strong or weak period will continue forever.
Value investing tools like StockIntent do much of this work for you. They average out margins, capital spending (capex) and returns on capital over several years. They also let you rank metrics like P/E, cash return on invested capital and margins against the company’s own history. That shows you if last year was a one-time outlier or part of a longer trend.
Once a company survives the screening and quality checks, the analysis shifts from discovery to valuation. At this stage, the question is no longer “Does this stock look cheap?” but “What would this business be worth under reasonable assumptions?”
For many operating companies, a discounted cash-flow framework is useful because it forces the investor to make the main assumptions explicit: future revenue, operating profitability, reinvestment, cash conversion, discount rate, and terminal economics.
But no single model fits every security. Banks, insurers, asset-heavy businesses, REITs, early-stage companies, and firms with unstable or negative cash flow may require a different framework or a much wider range of outcomes.
A practical workflow is to use an intrinsic value calculator only after the company has passed the earlier checks. The useful output is not a perfectly precise figure; it is a transparent range that can be challenged.
There are two common ways to build that DCF. Business schools teach the WACC model: discount cash flows at the weighted average cost of capital, then add a terminal value that grows forever. We prefer a simpler approach: set the discount rate to the return you want, forecast a few years, and end with a past multiple, like P/E or price to free cash flow. Why? WACC relies on beta and the equity risk premium, which are hard to pin down, and small changes in the forever growth rate swing the result. A past multiple you can check, and your target return you already know.
The StockIntent DCF calculator is built around this approach. While you type each assumption, it shows you the company’s one, three, five and ten year history right next to the input. You can see at a glance if last year was an outlier, what the average was, and where a more careful number would sit. This is how the assumptions look in StockIntent, with the history printed under each input.
If you prefer the WACC model, the ValuEdge intrinsic value calculator is designed for single-company analysis, exposing the assumptions behind the estimate and using model-aware valuation logic rather than presenting fair value as an unexplained number.
Growth: What growth rate is being assumed, for how long, and what supports it?
Margins: Are margins expected to expand, contract, or normalize?
Reinvestment: How much capital is required to produce the assumed growth?
Risk: What discount rate do you use? Your own required return, or a WACC that reflects the uncertainty and financing characteristics of the business?
Terminal value: What is the business worth at the end of the forecast? Which exit multiple is assumed and how does it compare with the company’s history, or which long-run growth rate and returns on capital are assumed forever?
Intrinsic value is highly sensitive to assumptions. A model that produces $100 per share under one set of inputs may produce a materially different result if margins normalize faster, growth slows, reinvestment rises, or the discount rate increases.
That is not a flaw in valuation. It is the reason the model should be stress-tested.
If a small change in one assumption destroys the apparent discount, the thesis is fragile. If the stock remains attractive across a reasonable range of assumptions, the valuation is more robust.
Good DCF tools build this in. The StockIntent DCF calculator has a low, mid and high scenario by default. You enter a careful case and a hopeful case at the same time, and see right away how much the fair value moves. The wider the gap between low and high, the more your result depends on your inputs. Here is the result in StockIntent: a fair value for each scenario, one weighted fair value and the margin of safety against today’s price.
Consider a hypothetical company trading at $24 per share. It earned $2.00 per share over the last twelve months, so the stock trades at 12 times earnings. At first glance, that may look inexpensive.
A deeper review shows that the company is in a cyclical industry. The last twelve months benefited from unusually strong pricing, operating margins are well above their ten-year median, and working-capital releases temporarily lifted free cash flow.
Instead of capitalizing $2.00 of peak earnings, assume normalized earnings are closer to $1.45 per share. The apparent 12× P/E immediately becomes roughly 16.6× normalized earnings.
Suppose a conservative case implies fair value of $20, a base case implies $25, and an optimistic case implies $31. The current $24 market price is not obviously a bargain. It sits close to the center of the range.
If the company must preserve peak margins for the optimistic case to work, the market price may already reflect a favorable outcome. The low trailing P/E did not reveal undervaluation; it reflected temporarily elevated earnings.
Lesson: valuation multiples are most useful when the denominator is economically normal. A cheap-looking ratio can disappear once the underlying fundamentals are normalized.
Because intrinsic value is an estimate, the difference between fair value and market price should compensate for uncertainty. That buffer is the margin of safety.
There is no universal percentage that works for every company. A stable business with predictable cash flows may justify a narrower buffer than a cyclical, leveraged, or rapidly changing business. The required margin should reflect the reliability of the inputs and the range of plausible outcomes.
A useful way to think about margin of safety is not as a target discount but as protection against being wrong. The less certain the business, the model, or the assumptions, the more demanding the investor should be about price.
This is one more reason we like the model where the discount rate is your desired return. If you are unsure about your assumptions, raise the discount rate. The fair value drops, and your margin of safety grows with it. If you are confident, you can use a lower rate. Because your target return is already built in, the model gives you the margin of safety directly, the way the StockIntent DCF calculator shows it next to the last price.
A valuation is a snapshot based on a set of assumptions. Those assumptions can change when a company reports results, raises capital, makes an acquisition, loses a major customer, changes guidance, or experiences a shift in industry economics.
The research process therefore does not end when a fair-value range is calculated. The investor should know which variables matter most to the thesis and what evidence would cause the valuation to be revised.
For one company, that may be gross margin and unit growth. For another, it may be credit losses, reinvestment intensity, regulatory capital, or customer concentration. Monitoring the thesis is more useful than monitoring the stock price alone.
That is why a value investing platform that covers the whole process is worth having. With StockIntent you screen, check quality, value and then track in one place. The StockIntent watchlist shows the metrics behind each thesis for every company you own or follow, so you see when a key number starts to slip. This is a StockIntent watchlist: one row per company, with the Score and your key metrics side by side.
Working through this list for every stock on a shortlist takes time. The StockIntent Score speeds up the first pass. It scores each company from 0 to 100 on eight fundamental metrics, including sales growth and stability, cash return on invested capital, dilution and free cash flow to debt. You can see in seconds which candidates pass the quality questions above and which need a closer look. Here is how the StockIntent Score looks on a company page, with its history and the eight metrics behind it.
A cheap stock trades at a low price relative to a metric such as earnings, book value, or cash flow. An undervalued stock trades below a defensible estimate of intrinsic value. A stock can be cheap because the business is deteriorating, so the two terms should not be treated as synonyms.
Usually, yes. A screen reduces a large universe to a smaller set of candidates that deserve deeper analysis. Running a detailed valuation on every stock is inefficient, while relying only on a screen is too shallow. The two steps solve different problems.
No. A low P/E can reflect temporary peak earnings, high financial risk, weak growth prospects, poor earnings quality, or structural decline. It is better used as a starting signal that requires normalization and further research.
Because valuation depends on assumptions that cannot be known with certainty. A range makes that uncertainty visible and encourages the investor to test how the conclusion changes when growth, margins, reinvestment, or the discount rate changes.
Margin of safety is the buffer between the market price and a reasonable estimate of value. Its purpose is to reduce the cost of estimation error, unexpected events, and overconfidence in the model.
Finding undervalued stocks is not about discovering the lowest multiple on a screen. It is a sequence of progressively harder questions.
Screen for potential mispricing → eliminate value traps → normalize the fundamentals → estimate intrinsic value → stress-test the assumptions → require a margin of safety → monitor the thesis.
The advantage of this process is not that it removes uncertainty. It makes uncertainty visible. A disciplined investor does not need every valuation to be correct; the goal is to avoid confusing a superficially cheap stock with a genuinely undervalued business.
