
Sep 16, 2026
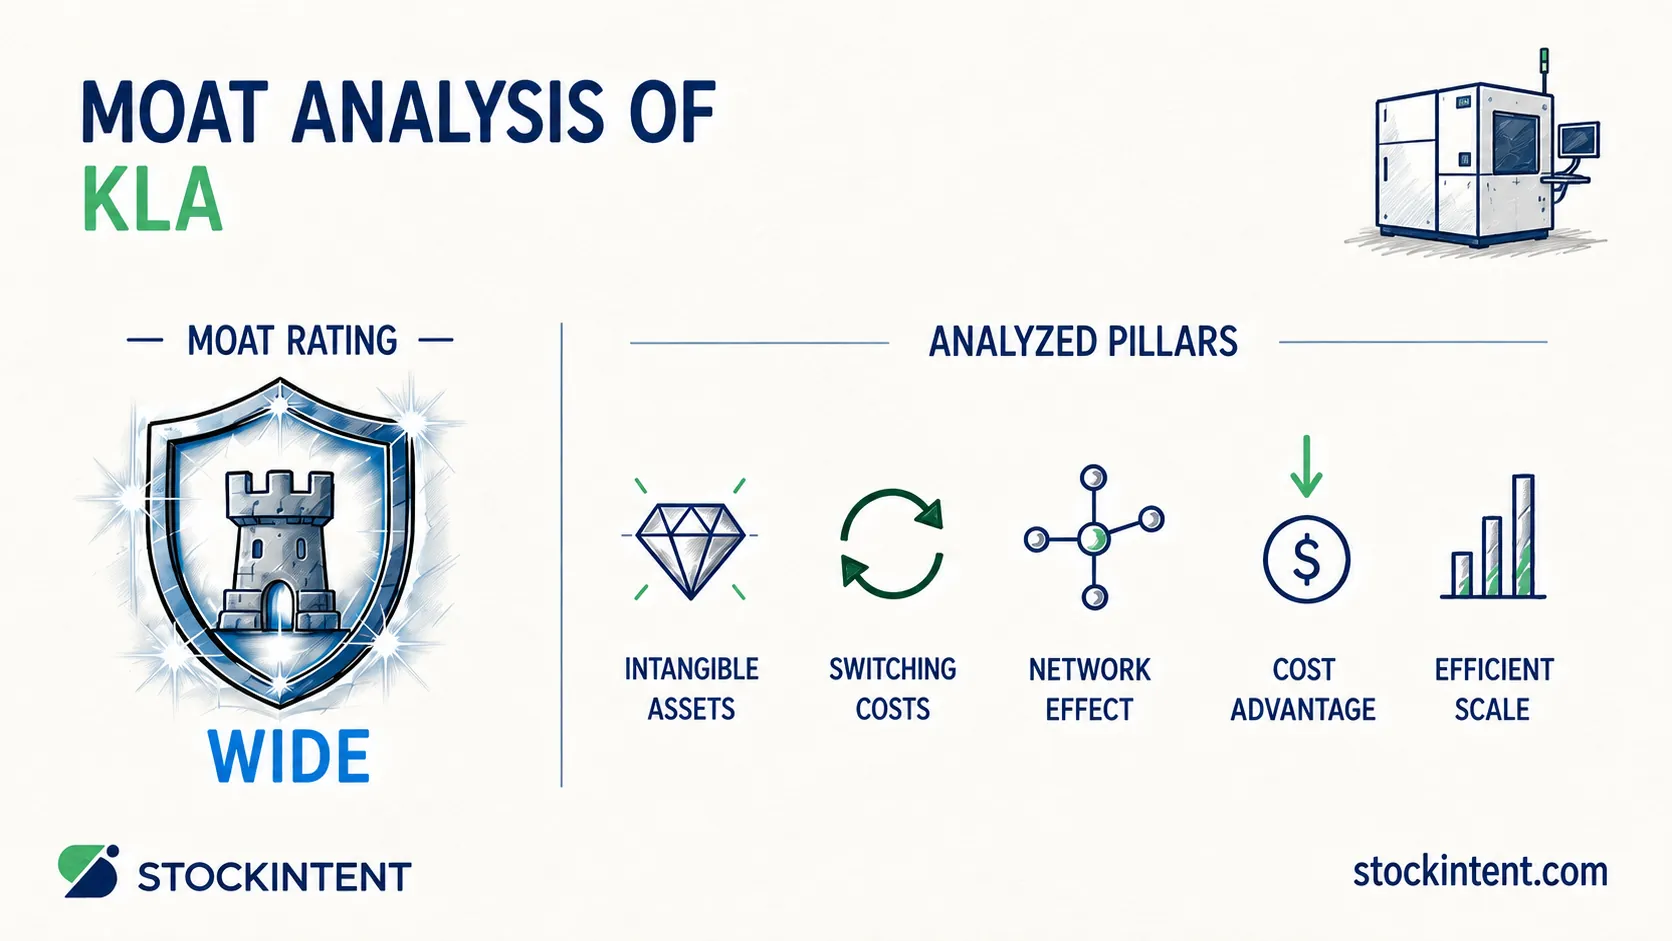
KLA earns a Wide Moat rating from us, with a Stable-to-Widening trend and Medium uncertainty. The company dominates semiconductor process control, and its FY2026 results back the verdict: KLA reported revenue of $13.58 billion (up roughly 12% year over year), net income of $4.83 billion, a gross margin near 61.3%, and an operating margin of 42.6%.
We'd sum up the assessment like this:
In this deep-dive analysis we will do an evaluation of long-term business quality and the durability of excess returns.
KLA's moat rests on two strong pillars: intangible assets and switching costs. The other three pillars range from secondary to barely relevant. Here's how each one stacks up.
Strength: Strong. This is the core of KLA's competitive advantage. KLA's 2026 patent filings show continued innovation in EUV and reticle inspection, AI-driven vision methods for defect detection, and synthetic defect data generation, with multiple patents assigned to KLA across these categories. Another deep asset is proprietary know-how: process recipes, algorithms, and optics accumulated over decades of leading-edge work. A 2026 patent-landscape analysis ranks intangible assets as KLA's strongest moat source.
This IP density protects the reinvestment runway behind returns on invested capital above 40% and the $3.35 billion KLA returned to shareholders in FY2026 through dividends and buybacks. Durable compounding needs a protected reinvestment runway, and patents plus know-how provide it.
Strength: Strong. KLA's tools are embedded in how fabs actually run. Replacement requires redoing tool-specific integration, calibration, recipes, data models, and tool-to-fab qualification. In leading-edge manufacturing, that's expensive and risky. The retention numbers prove it: service contracts renew at rates above 95%, average contract lengths exceed three years, and more than 99% of services revenue comes from supporting the installed base, per KLA's FY2026 investor presentation. TSMC has represented more than 10% of revenue since fiscal 2024, per KLA's 10-K filing. That concentration cuts both ways, but it confirms deep embedment rather than transactional selling.
Strength: Moderate. KLA's edge here is performance, not cheap production. Customers buy KLA tools for yield and process benefits, priced on cost-of-ownership value rather than scarcity. There's no strong 2026 evidence of a durable low-cost production edge across the market.
Strength: Weak-to-Moderate. The high-end process-control niche is specialized and capital intensive, which limits viable suppliers. But this isn't a natural monopoly. Onto Innovation, Lasertec, and others compete seriously in parts of inspection and metrology, so the pillar only partially applies.
Strength: Weak/Not Material. We found no evidence of true user-to-user value amplification in KLA's business.
Pro Insight: KLA's data feedback loops, where defect libraries and AI models improve as installed tools run, are often mistaken for network effects. They're really proprietary learning-curve advantages. That distinction matters for durability: learning curves can eventually be replicated by well-funded competitors, while true network effects create winner-take-most dynamics.
The overall picture: We think KLA has enough competitive advantages to defend wide-moat economics. The assessment leans heavily on intangibles and switching costs doing the work.
The moat shows up most clearly in margins. KLA's proprietary IP and embedded tools produced a 61.3% gross margin and a 42.6% operating margin in FY2026, per the company's earnings release. For semiconductor equipment, where most peers fight for gross margins in the 40s, that is impressive. It's what pricing power looks like when your tools are qualified into a fab and hard to replace.
Market position backs it up. KLA holds an estimated 58-60% of the process-control market and more than 73% share in broadband plasma optical inspection, per Flash StockSentinel's research. Share that concentrated only persists when customers keep choosing the technology leader.
The services base is the third visible proof point. Services revenue grew about 16% in FY2026 and now represents roughly 23% of total revenue, per TradingView's coverage. If you want to verify where the moat is visible in the numbers yourself, reviewing detailed company reports makes it easy to track margins, renewal rates, and competitive rankings over time.
Two limits deserve honesty. TSMC has represented more than 10% of KLA's revenue, and about 87% of revenue is international, per KLA's 10-K. Those figures don't directly trim the moat today, but they do cap how much absolute pricing power KLA can exercise when a major customer or a trade restriction moves against it.
We think the moat is currently Widening. However, the widening is gradual and driven by market expansion and mix shift, not a sudden leap in barriers to entry.
Three dynamics support the call.
First, the sector is shifting toward KLA. AI infrastructure and advanced packaging are increasing process-control intensity per wafer, and advanced packaging process-control revenue is expected to surge more than 70% in 2026, per Simply Wall St's analysis.
Second, industry structure favors incumbents: every new node and packaging flow raises the technical bar, which helps the vendor already embedded in fabs.
Third, customer buying patterns are extending. Management raised the 2026 wafer fab equipment market outlook to $140 billion-plus and flagged rare forward visibility into 2027 demand from greenfield fab activity, per Yahoo Finance's earnings coverage. Q4 FY2026 gross margin of 62.4%, per KLA's earnings release, shows the economics holding while the mix shifts.
We read this as widening rather than a cyclical rebound because the advanced packaging and services expansion adds addressable market and deepens switching costs. But share loss in emerging inspection categories or a packaging slowdown would influence, and potentially reverse the call.
In conclusion the widening trend is our base case, but as always it's contingent on execution.
Our uncertainty rating is Medium. Four drivers explain it, and none of them threaten the core competitive position. They just widen the range of revenue and margin outcomes around it.
Cyclicality comes first. Semiconductor capital spending still swings, and services growth smooths but does not eliminate that exposure. Second, concentration: TSMC has historically represented more than 10% of revenue, and China exposure is meaningful. Third, geopolitics. With about 87% of revenue international, export controls and trade barriers can disrupt shipments quickly. Fourth, margins. Management has flagged 75-100 basis points of gross margin headwind from DRAM component costs and tariff pressure in FY2026 guidance, per the Q4 FY2026 earnings call. The moat is strong, but it doesn't provide unlimited pricing insulation.
The balance sheet keeps the range moderate rather than extreme. KLA ended Q4 FY2026 with roughly $4.9 billion in cash and marketable securities against $5.9 billion of debt, per the same earnings call. That cushion bounds the downside.
Evidence improves decisions without removing uncertainty: Our Medium rating reflects bounded downside from technical leadership, alongside real variability in the timing and magnitude of growth.
Our analysis showcased a Wide Moat, Stable-to-Widening trend, and Medium uncertainty. The evidence behind it is durable process-control leadership (58-60% market share), exceptional economics (61.3% gross margin), and a growing recurring services base (16% growth, renewals above 95%).
Two issues matter most from here. First, can KLA keep its technical lead as manufacturing complexity rises? Its moat depends on it. Second, can services growth keep offsetting equipment cyclicality? That streak is the cleanest test of switching costs.
Watch the provided indicators each quarter: market share, packaging growth, the services run, and gross margin. Those four numbers will tell you whether the trend is widening or weakening long before the headlines do.
This content is for informational and educational purposes only and is not investment advice. Investors should conduct their own research or consult a qualified professional before making investment decisions.
KLA earns a Wide Moat rating from us, with a Stable-to-Widening trend and Medium uncertainty. The company dominates semiconductor process control, and its FY2026 results back the verdict: KLA reported revenue of $13.58 billion (up roughly 12% year over year), net income of $4.83 billion, a gross margin near 61.3%, and an operating margin of 42.6%.
We'd sum up the assessment like this:
In this deep-dive analysis we will do an evaluation of long-term business quality and the durability of excess returns.
KLA's moat rests on two strong pillars: intangible assets and switching costs. The other three pillars range from secondary to barely relevant. Here's how each one stacks up.
Strength: Strong. This is the core of KLA's competitive advantage. KLA's 2026 patent filings show continued innovation in EUV and reticle inspection, AI-driven vision methods for defect detection, and synthetic defect data generation, with multiple patents assigned to KLA across these categories. Another deep asset is proprietary know-how: process recipes, algorithms, and optics accumulated over decades of leading-edge work. A 2026 patent-landscape analysis ranks intangible assets as KLA's strongest moat source.
This IP density protects the reinvestment runway behind returns on invested capital above 40% and the $3.35 billion KLA returned to shareholders in FY2026 through dividends and buybacks. Durable compounding needs a protected reinvestment runway, and patents plus know-how provide it.
Strength: Strong. KLA's tools are embedded in how fabs actually run. Replacement requires redoing tool-specific integration, calibration, recipes, data models, and tool-to-fab qualification. In leading-edge manufacturing, that's expensive and risky. The retention numbers prove it: service contracts renew at rates above 95%, average contract lengths exceed three years, and more than 99% of services revenue comes from supporting the installed base, per KLA's FY2026 investor presentation. TSMC has represented more than 10% of revenue since fiscal 2024, per KLA's 10-K filing. That concentration cuts both ways, but it confirms deep embedment rather than transactional selling.
Strength: Moderate. KLA's edge here is performance, not cheap production. Customers buy KLA tools for yield and process benefits, priced on cost-of-ownership value rather than scarcity. There's no strong 2026 evidence of a durable low-cost production edge across the market.
Strength: Weak-to-Moderate. The high-end process-control niche is specialized and capital intensive, which limits viable suppliers. But this isn't a natural monopoly. Onto Innovation, Lasertec, and others compete seriously in parts of inspection and metrology, so the pillar only partially applies.
Strength: Weak/Not Material. We found no evidence of true user-to-user value amplification in KLA's business.
Pro Insight: KLA's data feedback loops, where defect libraries and AI models improve as installed tools run, are often mistaken for network effects. They're really proprietary learning-curve advantages. That distinction matters for durability: learning curves can eventually be replicated by well-funded competitors, while true network effects create winner-take-most dynamics.
The overall picture: We think KLA has enough competitive advantages to defend wide-moat economics. The assessment leans heavily on intangibles and switching costs doing the work.
The moat shows up most clearly in margins. KLA's proprietary IP and embedded tools produced a 61.3% gross margin and a 42.6% operating margin in FY2026, per the company's earnings release. For semiconductor equipment, where most peers fight for gross margins in the 40s, that is impressive. It's what pricing power looks like when your tools are qualified into a fab and hard to replace.
Market position backs it up. KLA holds an estimated 58-60% of the process-control market and more than 73% share in broadband plasma optical inspection, per Flash StockSentinel's research. Share that concentrated only persists when customers keep choosing the technology leader.
The services base is the third visible proof point. Services revenue grew about 16% in FY2026 and now represents roughly 23% of total revenue, per TradingView's coverage. If you want to verify where the moat is visible in the numbers yourself, reviewing detailed company reports makes it easy to track margins, renewal rates, and competitive rankings over time.
Two limits deserve honesty. TSMC has represented more than 10% of KLA's revenue, and about 87% of revenue is international, per KLA's 10-K. Those figures don't directly trim the moat today, but they do cap how much absolute pricing power KLA can exercise when a major customer or a trade restriction moves against it.
We think the moat is currently Widening. However, the widening is gradual and driven by market expansion and mix shift, not a sudden leap in barriers to entry.
Three dynamics support the call.
First, the sector is shifting toward KLA. AI infrastructure and advanced packaging are increasing process-control intensity per wafer, and advanced packaging process-control revenue is expected to surge more than 70% in 2026, per Simply Wall St's analysis.
Second, industry structure favors incumbents: every new node and packaging flow raises the technical bar, which helps the vendor already embedded in fabs.
Third, customer buying patterns are extending. Management raised the 2026 wafer fab equipment market outlook to $140 billion-plus and flagged rare forward visibility into 2027 demand from greenfield fab activity, per Yahoo Finance's earnings coverage. Q4 FY2026 gross margin of 62.4%, per KLA's earnings release, shows the economics holding while the mix shifts.
We read this as widening rather than a cyclical rebound because the advanced packaging and services expansion adds addressable market and deepens switching costs. But share loss in emerging inspection categories or a packaging slowdown would influence, and potentially reverse the call.
In conclusion the widening trend is our base case, but as always it's contingent on execution.
Our uncertainty rating is Medium. Four drivers explain it, and none of them threaten the core competitive position. They just widen the range of revenue and margin outcomes around it.
Cyclicality comes first. Semiconductor capital spending still swings, and services growth smooths but does not eliminate that exposure. Second, concentration: TSMC has historically represented more than 10% of revenue, and China exposure is meaningful. Third, geopolitics. With about 87% of revenue international, export controls and trade barriers can disrupt shipments quickly. Fourth, margins. Management has flagged 75-100 basis points of gross margin headwind from DRAM component costs and tariff pressure in FY2026 guidance, per the Q4 FY2026 earnings call. The moat is strong, but it doesn't provide unlimited pricing insulation.
The balance sheet keeps the range moderate rather than extreme. KLA ended Q4 FY2026 with roughly $4.9 billion in cash and marketable securities against $5.9 billion of debt, per the same earnings call. That cushion bounds the downside.
Evidence improves decisions without removing uncertainty: Our Medium rating reflects bounded downside from technical leadership, alongside real variability in the timing and magnitude of growth.
Our analysis showcased a Wide Moat, Stable-to-Widening trend, and Medium uncertainty. The evidence behind it is durable process-control leadership (58-60% market share), exceptional economics (61.3% gross margin), and a growing recurring services base (16% growth, renewals above 95%).
Two issues matter most from here. First, can KLA keep its technical lead as manufacturing complexity rises? Its moat depends on it. Second, can services growth keep offsetting equipment cyclicality? That streak is the cleanest test of switching costs.
Watch the provided indicators each quarter: market share, packaging growth, the services run, and gross margin. Those four numbers will tell you whether the trend is widening or weakening long before the headlines do.
This content is for informational and educational purposes only and is not investment advice. Investors should conduct their own research or consult a qualified professional before making investment decisions.