
Sep 16, 2026
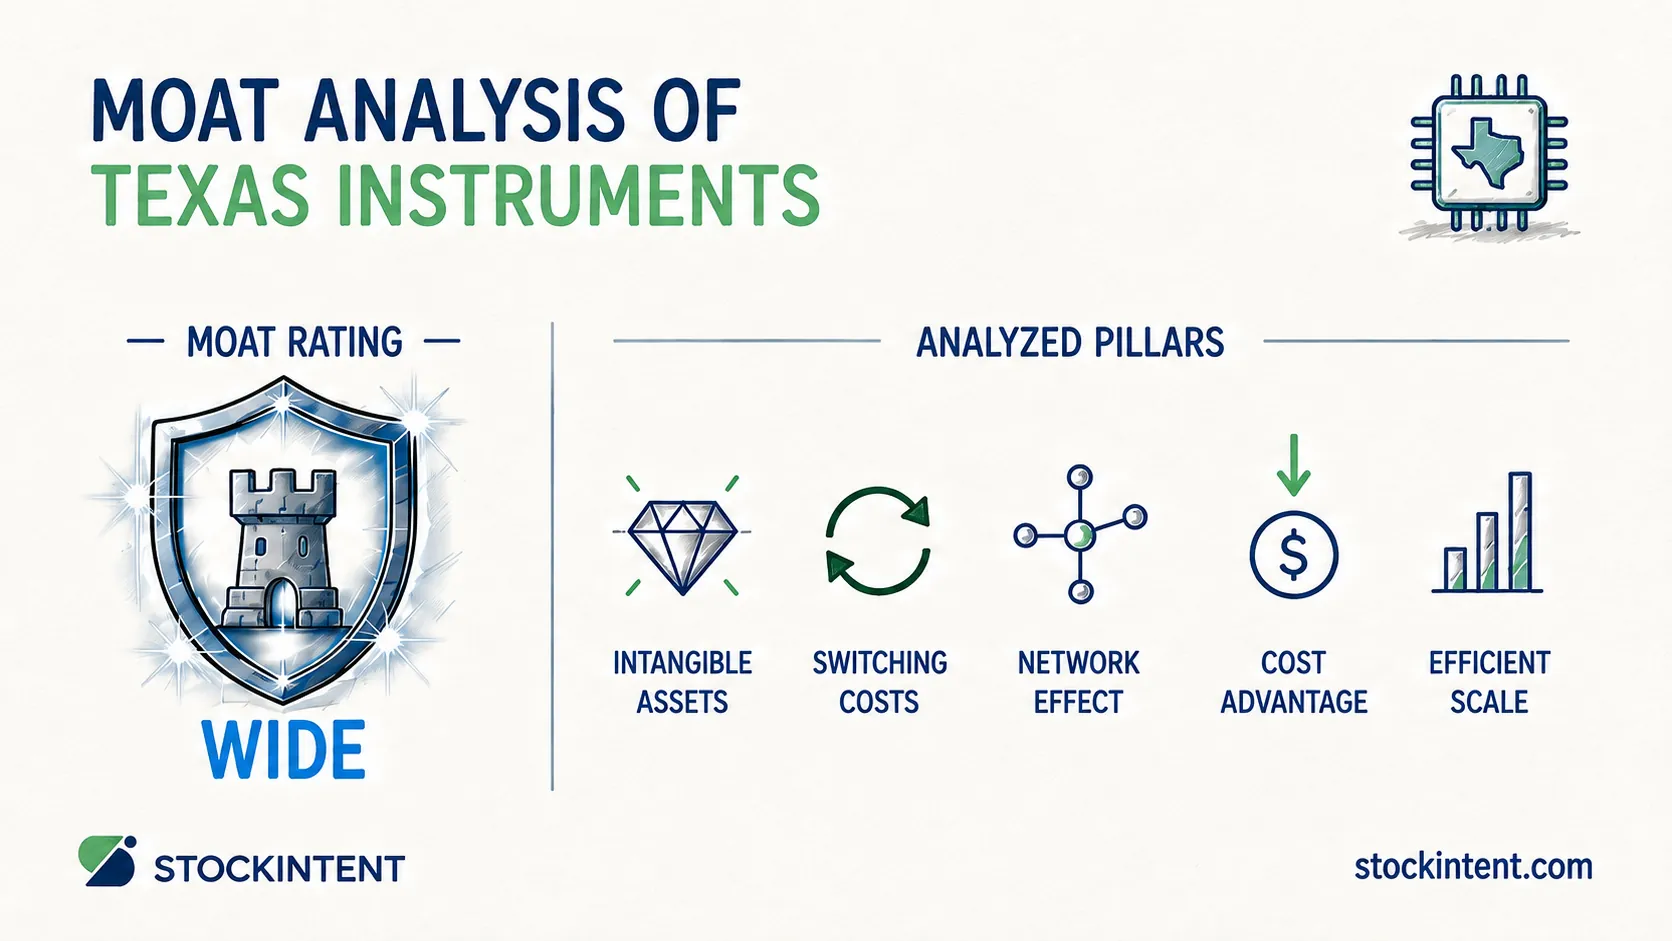
Our verdict: Texas Instruments earns a Wide Moat with a Stable to Widening trend and Medium uncertainty. The Q2 2026 numbers back that up. TI reported $5.46 billion in revenue, up 23% year over year, with a 61% gross margin and $1.98 billion in net income. It also returned $5.8 billion to shareholders over the trailing 12 months, and guided Q3 2026 revenue to $5.65-$6.15 billion.
The quick takeaways:
For long-term compounders, moat durability separates temporary cyclical weakness from permanent erosion. That distinction, not today's price, determines whether TI's economics keep compounding for years. Let's go deeper into the numbers!
Three of the five classic moat pillars do the heavy lifting for TI: switching costs, cost advantage, and efficient scale. One is a supporting player, and one simply doesn't apply. Here's how each stacks up, strongest first.
Evidence: Strong. TI's analog and embedded chips are designed into customer systems for product lifecycles that often run a decade or longer. Swapping one out means redesign, requalification, and supply-chain rework. TI's 2026 Form 10-K describes exactly this entrenchment across industrial, automotive, and data-center sockets. The one caveat: customers can dual-source or redesign over time, so switching costs can in theory also just slow erosion rather than stop it permanently.
Evidence: Strong. TI's 300mm wafer manufacturing gives it structurally lower chip costs than rivals running older 200mm lines. That shows up in a Q2 2026 operating margin of roughly 42% alongside the 61% gross margin, numbers few analog peers match at scale.
Pro Insights: We'd flag one nuance: much of this edge is really manufacturing scale rather than pure unit-cost superiority, which is why cost advantage and efficient scale blur together here.
Evidence: Strong. TI serves an estimated 100,000+ customers and generated $17.68 billion in 2025 revenue per its Form 10-K. This shows that TI can run enormous fab volume in a fragmented market. Its 2025 return on invested capital landed at the 70th percentile of the S&P 500, which tells you the scale converts into real returns.
Evidence: Moderate. TI benefits from decades of engineering trust with industrial and automotive buyers, plus a deep product catalog. But the filings stress ongoing competition and the need to keep innovating, which tells you that patents and brand need to be continuously improved.
Evidence: Weak / not material. None that we can find. A TI chip in a factory controller doesn't get more valuable because another customer bought one. The business is explained entirely by design-in persistence and manufacturing economics.
The overall structure is clear. Switching costs, cost advantage, and efficient scale reinforce each other, and that combination, not any single pillar, is what protects TI's economics. If you want to run this same pillar-by-pillar check on TI's peers, StockIntent's company reports let you compare margin trends, capital efficiency, and historical evolution side by side.
The moat is visible in three places, and each one traces back to the pillars above.
First, margins. A 61% gross margin and roughly 42% operating margin in Q2 2026 are not accidents. They are what happens when customers cannot easily swap out your chips and your wafer costs run below most rivals'. Few analog peers sustain that combination at TI's volume.
Second, cash. TI returned $5.8 billion to shareholders over the trailing 12 months through Q2 2026 while still spending on R&D and factories. Scale economics that fund both are the efficient-scale pillar doing its job.
Third, capital efficiency. TI's 2025 return on invested capital landed at the 70th percentile of the S&P 500. Above-average returns on a huge capital base are the financial signature of a working moat.
Now the honest caveat: TI's gross margin peaked near 70% in past cycles, well above today's 61%. That gap tells you the moat is structurally intact but operating with cyclical variations.
Pro Insight: In our experience, investors often confuse TI's cyclicality with moat erosion. The distinction matters. Cyclical demand swings are temporary, while manufacturing scale and design-in persistence create durable economics through cycles. A 61% gross margin during a recovery, with 300mm capacity still ramping, suggests the moat structure remains intact.
Our trend call: Stable to Widening. Widening near-term on demand recovery, structurally stable underneath. Here is the reasoning, plus what would change our mind.
The near-term widening is observable in the data. TI's Q2 2026 earnings call described demand broadening across industrial, automotive, and data center, with data center power conversion standing out. When growth spreads across three end markets instead of leaning on one, the 100,000+ customer base becomes a genuine buffer and tailwind.
Structurally, the 300mm manufacturing ramp is progressing, and that is the engine of the cost advantage. But the capex picture cuts both ways. TI spent roughly $3.3 billion on capital expenditures over the trailing 12 months through Q2 2026, down from about $4.1 billion through Q1. Moderating spend helps free cash flow, yet it also narrows the margin for error if the ramp hits delays. Add steady pressure from well-capitalized rivals like Analog Devices, Infineon, and STMicroelectronics, and the trend is positive but not locked in.
Here is our watchlist of four indicators for the next 3-5 years:
You can track key indicators like this with StockIntent's watchlists, comparing TI against peers on margins, growth, and capital efficiency as new quarters land.
Our uncertainty rating: Medium.
We don't see the business as fragile, but the range of plausible 3-5 year outcomes is genuinely wider than a consumer staple's - even with a wide moat in place.
Start with sales predictability. TI's 100,000+ customer base and long product lifecycles make revenue more predictable than most semiconductor peers. But the 2026 Form 10-K still warns that demand swings, shipment volumes, and product mix can move results materially, and its revenue sits on cyclical industrial and automotive foundations.
Operating stability is a mixed picture. High margins give cushion, and demand broadened across industrial, automotive, and data center in 2026. Yet the same filing explicitly cites tariffs as a margin factor, and utilization can swing with inventory cycles.
Capital requirements are the biggest swing factor. Roughly $3.3 billion in trailing capex means heavy depreciation loads if demand softens before new fabs fully absorb. That's execution risk layered on top of cyclical risk, and a downturn arriving at peak capex is the scenario that could impact and narrow the moat as a result.
Pro Insights: Uncertainty here isn't stock volatility. It's how wide the gap could be between TI compounding strongly and TI staying profitable but earning weaker returns on its deployed capital. That spread is meaningful but not extreme, which is why Medium, not High, fits.
Texas Instruments earns a Wide Moat with a Stable to Widening trend and Medium uncertainty. A 61% gross margin shows pricing power, $5.8 billion in trailing shareholder returns shows capital-allocation capacity, and the 300mm manufacturing ramp keeps building the cost advantage. Those three facts, taken together, have a positive impact on the moat.
From here, one issue matters more than everything else: executing the 300mm transition through the next semiconductor cycle. A downturn that lands at peak capex, sustained share loss to ADI, Infineon, or STMicro, or 300mm yield failures would force us to revisit the rating. Absent those, we'd view margin dips as cyclical noise.
In our view, that's the disciplined way to hold a cyclical compounder: track the structure, tolerate the cycle, and let the economics do the compounding.
Our verdict: Texas Instruments earns a Wide Moat with a Stable to Widening trend and Medium uncertainty. The Q2 2026 numbers back that up. TI reported $5.46 billion in revenue, up 23% year over year, with a 61% gross margin and $1.98 billion in net income. It also returned $5.8 billion to shareholders over the trailing 12 months, and guided Q3 2026 revenue to $5.65-$6.15 billion.
The quick takeaways:
For long-term compounders, moat durability separates temporary cyclical weakness from permanent erosion. That distinction, not today's price, determines whether TI's economics keep compounding for years. Let's go deeper into the numbers!
Three of the five classic moat pillars do the heavy lifting for TI: switching costs, cost advantage, and efficient scale. One is a supporting player, and one simply doesn't apply. Here's how each stacks up, strongest first.
Evidence: Strong. TI's analog and embedded chips are designed into customer systems for product lifecycles that often run a decade or longer. Swapping one out means redesign, requalification, and supply-chain rework. TI's 2026 Form 10-K describes exactly this entrenchment across industrial, automotive, and data-center sockets. The one caveat: customers can dual-source or redesign over time, so switching costs can in theory also just slow erosion rather than stop it permanently.
Evidence: Strong. TI's 300mm wafer manufacturing gives it structurally lower chip costs than rivals running older 200mm lines. That shows up in a Q2 2026 operating margin of roughly 42% alongside the 61% gross margin, numbers few analog peers match at scale.
Pro Insights: We'd flag one nuance: much of this edge is really manufacturing scale rather than pure unit-cost superiority, which is why cost advantage and efficient scale blur together here.
Evidence: Strong. TI serves an estimated 100,000+ customers and generated $17.68 billion in 2025 revenue per its Form 10-K. This shows that TI can run enormous fab volume in a fragmented market. Its 2025 return on invested capital landed at the 70th percentile of the S&P 500, which tells you the scale converts into real returns.
Evidence: Moderate. TI benefits from decades of engineering trust with industrial and automotive buyers, plus a deep product catalog. But the filings stress ongoing competition and the need to keep innovating, which tells you that patents and brand need to be continuously improved.
Evidence: Weak / not material. None that we can find. A TI chip in a factory controller doesn't get more valuable because another customer bought one. The business is explained entirely by design-in persistence and manufacturing economics.
The overall structure is clear. Switching costs, cost advantage, and efficient scale reinforce each other, and that combination, not any single pillar, is what protects TI's economics. If you want to run this same pillar-by-pillar check on TI's peers, StockIntent's company reports let you compare margin trends, capital efficiency, and historical evolution side by side.
The moat is visible in three places, and each one traces back to the pillars above.
First, margins. A 61% gross margin and roughly 42% operating margin in Q2 2026 are not accidents. They are what happens when customers cannot easily swap out your chips and your wafer costs run below most rivals'. Few analog peers sustain that combination at TI's volume.
Second, cash. TI returned $5.8 billion to shareholders over the trailing 12 months through Q2 2026 while still spending on R&D and factories. Scale economics that fund both are the efficient-scale pillar doing its job.
Third, capital efficiency. TI's 2025 return on invested capital landed at the 70th percentile of the S&P 500. Above-average returns on a huge capital base are the financial signature of a working moat.
Now the honest caveat: TI's gross margin peaked near 70% in past cycles, well above today's 61%. That gap tells you the moat is structurally intact but operating with cyclical variations.
Pro Insight: In our experience, investors often confuse TI's cyclicality with moat erosion. The distinction matters. Cyclical demand swings are temporary, while manufacturing scale and design-in persistence create durable economics through cycles. A 61% gross margin during a recovery, with 300mm capacity still ramping, suggests the moat structure remains intact.
Our trend call: Stable to Widening. Widening near-term on demand recovery, structurally stable underneath. Here is the reasoning, plus what would change our mind.
The near-term widening is observable in the data. TI's Q2 2026 earnings call described demand broadening across industrial, automotive, and data center, with data center power conversion standing out. When growth spreads across three end markets instead of leaning on one, the 100,000+ customer base becomes a genuine buffer and tailwind.
Structurally, the 300mm manufacturing ramp is progressing, and that is the engine of the cost advantage. But the capex picture cuts both ways. TI spent roughly $3.3 billion on capital expenditures over the trailing 12 months through Q2 2026, down from about $4.1 billion through Q1. Moderating spend helps free cash flow, yet it also narrows the margin for error if the ramp hits delays. Add steady pressure from well-capitalized rivals like Analog Devices, Infineon, and STMicroelectronics, and the trend is positive but not locked in.
Here is our watchlist of four indicators for the next 3-5 years:
You can track key indicators like this with StockIntent's watchlists, comparing TI against peers on margins, growth, and capital efficiency as new quarters land.
Our uncertainty rating: Medium.
We don't see the business as fragile, but the range of plausible 3-5 year outcomes is genuinely wider than a consumer staple's - even with a wide moat in place.
Start with sales predictability. TI's 100,000+ customer base and long product lifecycles make revenue more predictable than most semiconductor peers. But the 2026 Form 10-K still warns that demand swings, shipment volumes, and product mix can move results materially, and its revenue sits on cyclical industrial and automotive foundations.
Operating stability is a mixed picture. High margins give cushion, and demand broadened across industrial, automotive, and data center in 2026. Yet the same filing explicitly cites tariffs as a margin factor, and utilization can swing with inventory cycles.
Capital requirements are the biggest swing factor. Roughly $3.3 billion in trailing capex means heavy depreciation loads if demand softens before new fabs fully absorb. That's execution risk layered on top of cyclical risk, and a downturn arriving at peak capex is the scenario that could impact and narrow the moat as a result.
Pro Insights: Uncertainty here isn't stock volatility. It's how wide the gap could be between TI compounding strongly and TI staying profitable but earning weaker returns on its deployed capital. That spread is meaningful but not extreme, which is why Medium, not High, fits.
Texas Instruments earns a Wide Moat with a Stable to Widening trend and Medium uncertainty. A 61% gross margin shows pricing power, $5.8 billion in trailing shareholder returns shows capital-allocation capacity, and the 300mm manufacturing ramp keeps building the cost advantage. Those three facts, taken together, have a positive impact on the moat.
From here, one issue matters more than everything else: executing the 300mm transition through the next semiconductor cycle. A downturn that lands at peak capex, sustained share loss to ADI, Infineon, or STMicro, or 300mm yield failures would force us to revisit the rating. Absent those, we'd view margin dips as cyclical noise.
In our view, that's the disciplined way to hold a cyclical compounder: track the structure, tolerate the cycle, and let the economics do the compounding.