The
Financial Visualization Platform
 for
Value
 Investors

A financial visualization platform built for value investors. See 20+ years of fundamentals as charts, spot trends fast, and test your price with DCF and intrinsic value models.

Explore StockIntent Free

Access all features · Free for 7 days · Cancel anytime

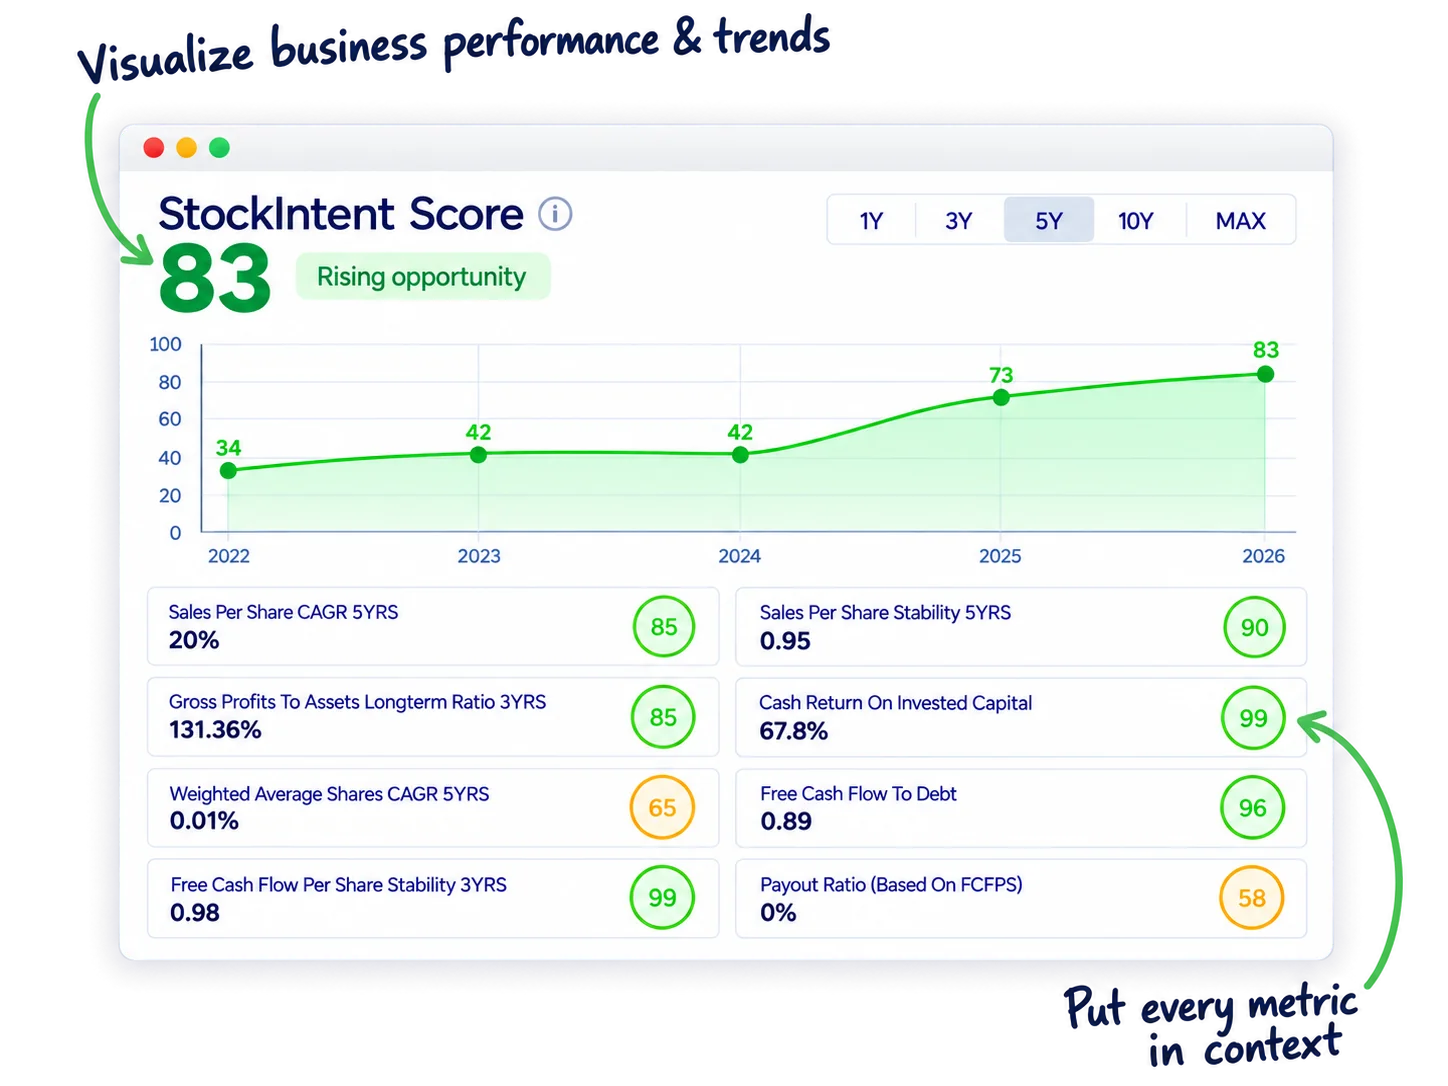
Financial visualization platform showing StockIntent Score history and eight contributing metrics, with illustrative sales growth and stability values
The Real Problem

Can You See the Story Behind the Numbers?

BEFOREAFTER

Financial data visualization matters because numbers only help when you can see what is changing, how companies compare and where trends point.

Scattered financial tools and spreadsheets
BEFORE
  • Scanning endless tables of financial figures?
  • Building charts manually in spreadsheets?
  • Switching tools just to compare companies?
  • Struggling to spot long-term financial trends?
  • Deciding without a clear visual overview?
StockIntent
AFTER
  • Visualize thousands of metrics in one place
  • See long-term company trends at a glance
  • Compare companies and sectors consistently
  • Pair charts with fundamental research
  • Go from visual insight to backtesting
Platform Features

Stop Reading Tables.
Start Seeing Trends
 in Fundamentals

Charts show you what changed. Valuation models tell you what it is worth. Backtests show if your idea would have worked.

Market Dashboard

Spot Market Trends Before They Hit the Headlines

Investment visualization tools for the whole market. See which factors, sectors and regions lead or lag, and how the index moves over any time frame.

  • Track the S&P 500 and Nasdaq over any period
  • See factors, sectors and regions move in one view
  • Spot if value, growth or small caps are leading
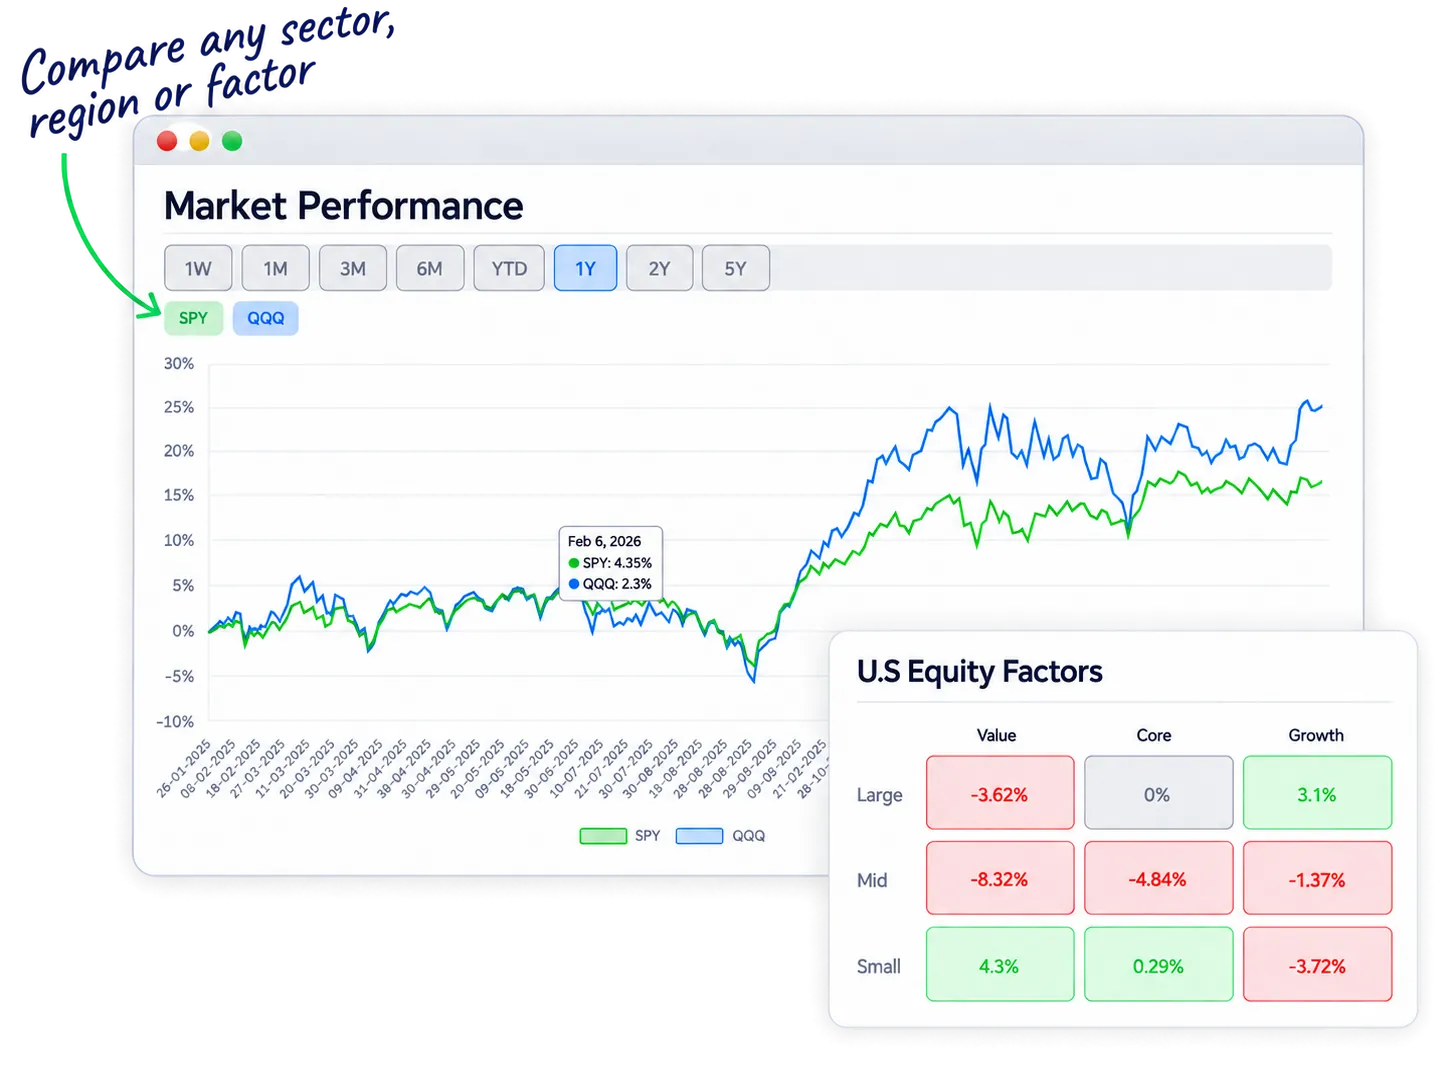
StockIntent market dashboard comparing index performance and equity factor returns to identify differences across value, growth and company sizes
Data Browser

Any Company, Any Metric, Instantly in Context

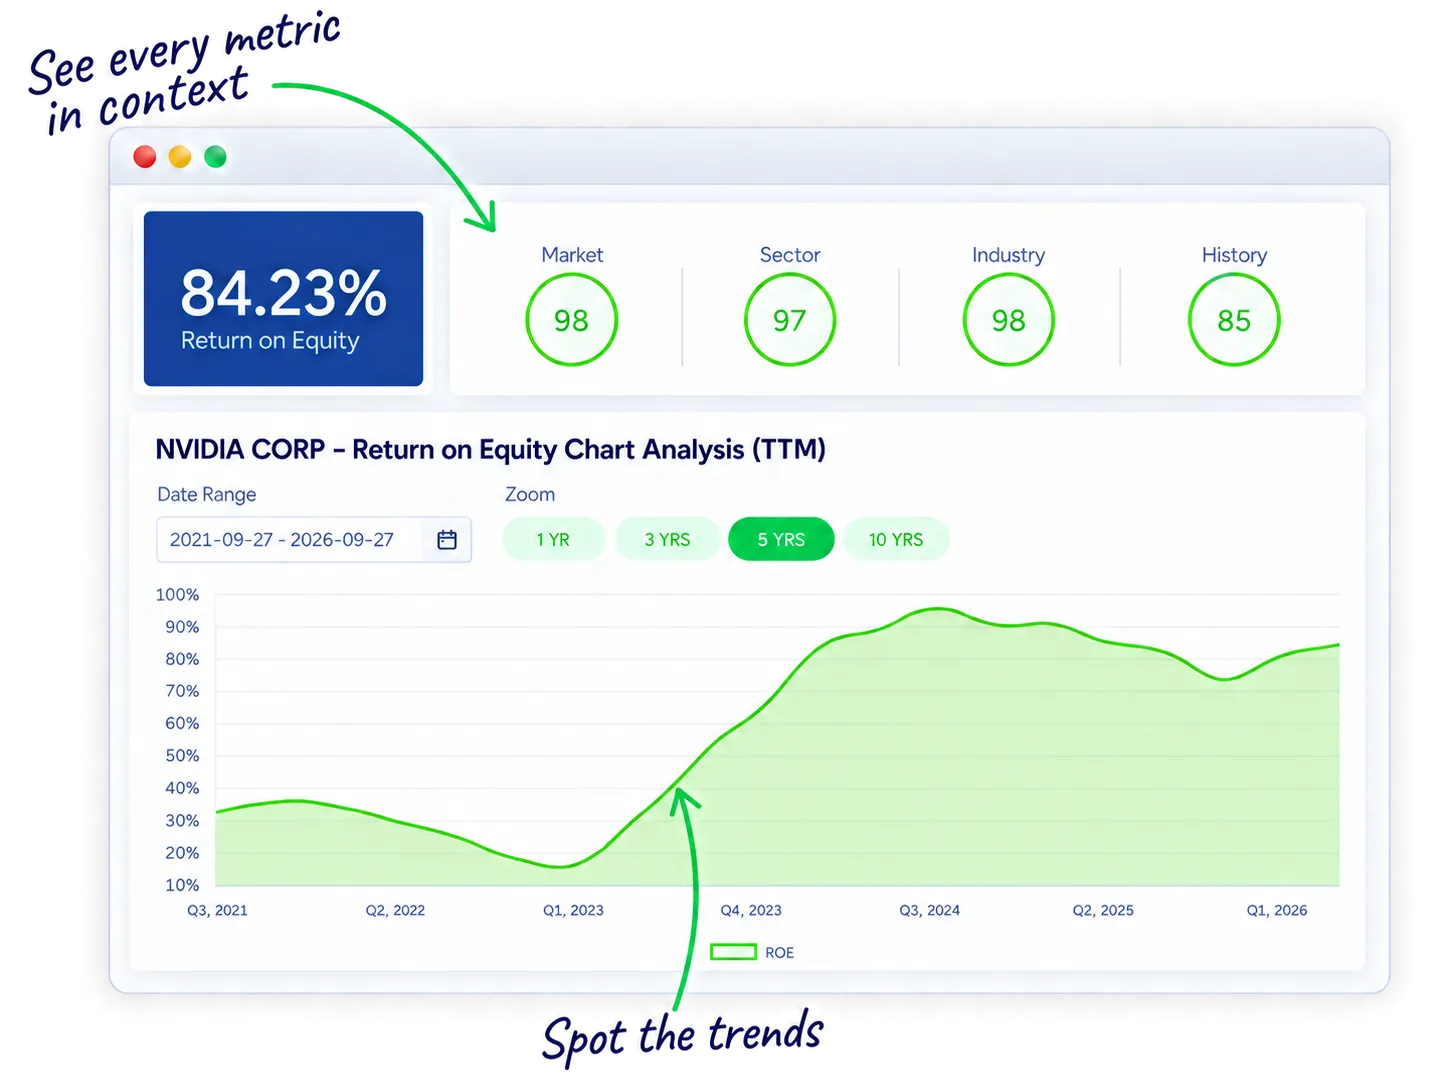
Pick any of 4,000+ metrics and see it as a chart. Watch it change over time, see where it ranks, and benchmark it against the whole market.

  • Chart any metric over 1 to 10 years
  • Rank vs market, sector, industry and history
  • See how a company measures up
NVIDIA return on equity trends in StockIntent alongside market, sector, industry and historical ranks to put profitability in context
Company Reports

See Financial Trends at a Glance

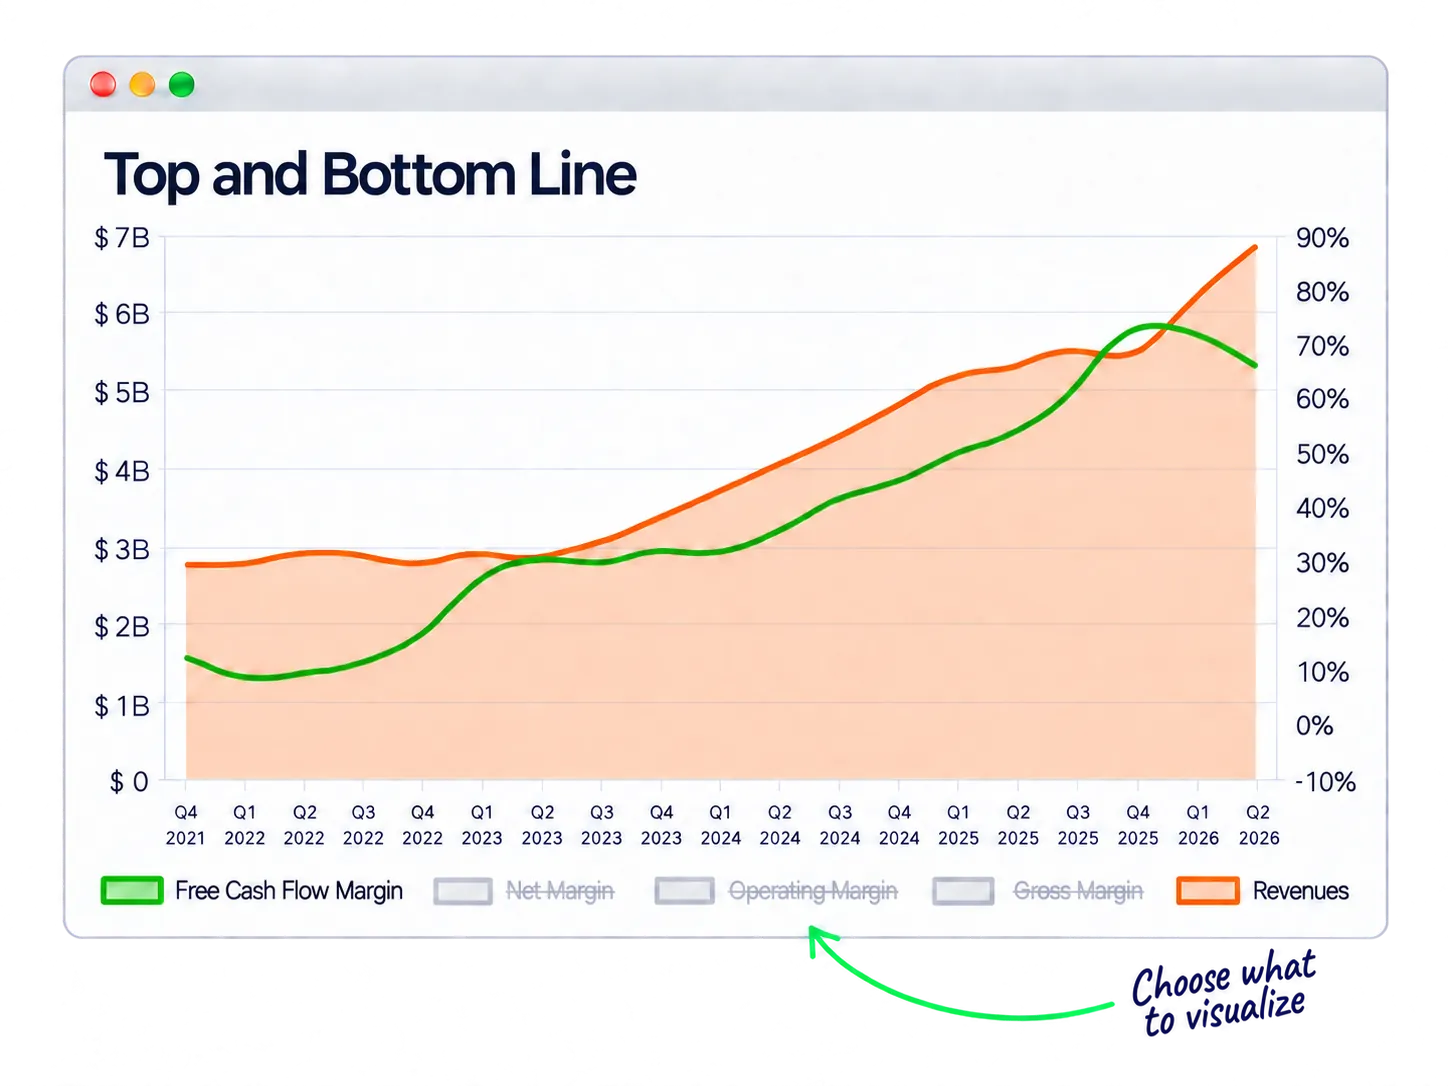
Stock data visualization turns years of company fundamentals into visual context, so changes in revenue, earnings, margins and valuation stand out fast.

  • Visualize multi-year financial trends
  • Track valuation, growth and financial health
  • Spot changes that are difficult to see in raw tables
AppLovin revenue and free cash flow margin trends in StockIntent, with selectable margins for comparing business growth and cash generation
Valuation Models

Know If a Stock Is Cheap Before You Buy

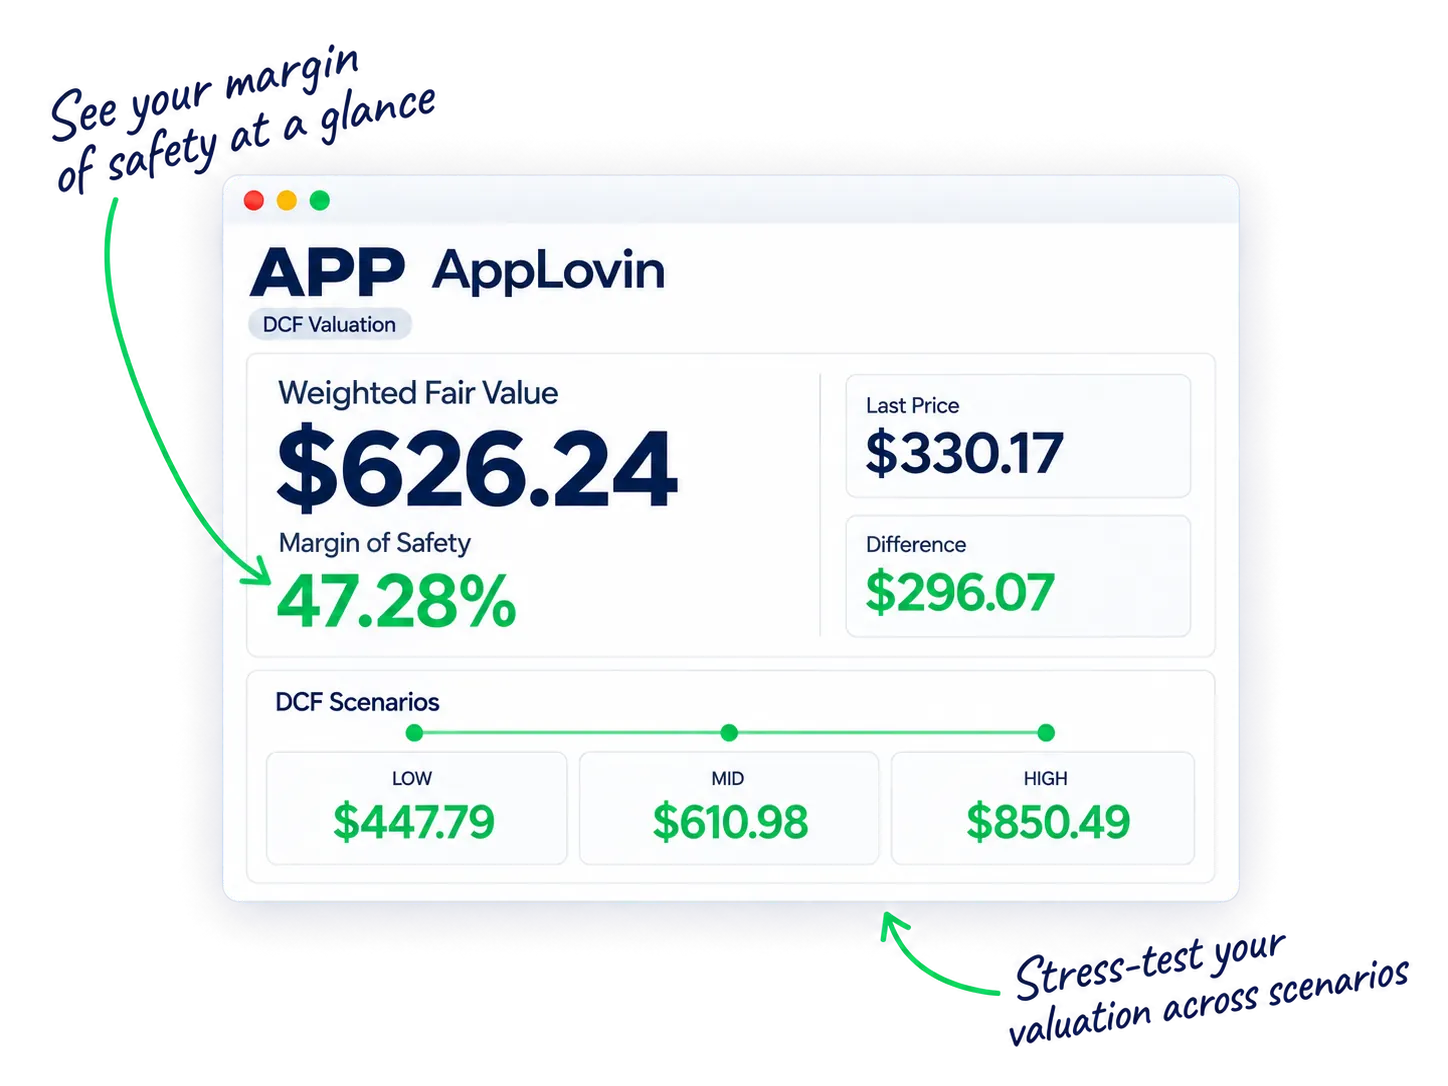
Build a valuation model and measure intrinsic value. One visual shows your margin of safety, so you see how much room the price leaves you.

  • Prebuilt DCF and intrinsic value models
  • See your margin of safety at a glance
  • Compare fair value with today's price
AppLovin DCF valuation in StockIntent showing estimated fair value, margin of safety and low, mid and high scenarios to compare valuation outcomes
Backtesting

See If Your Strategy Works Before You Risk Money

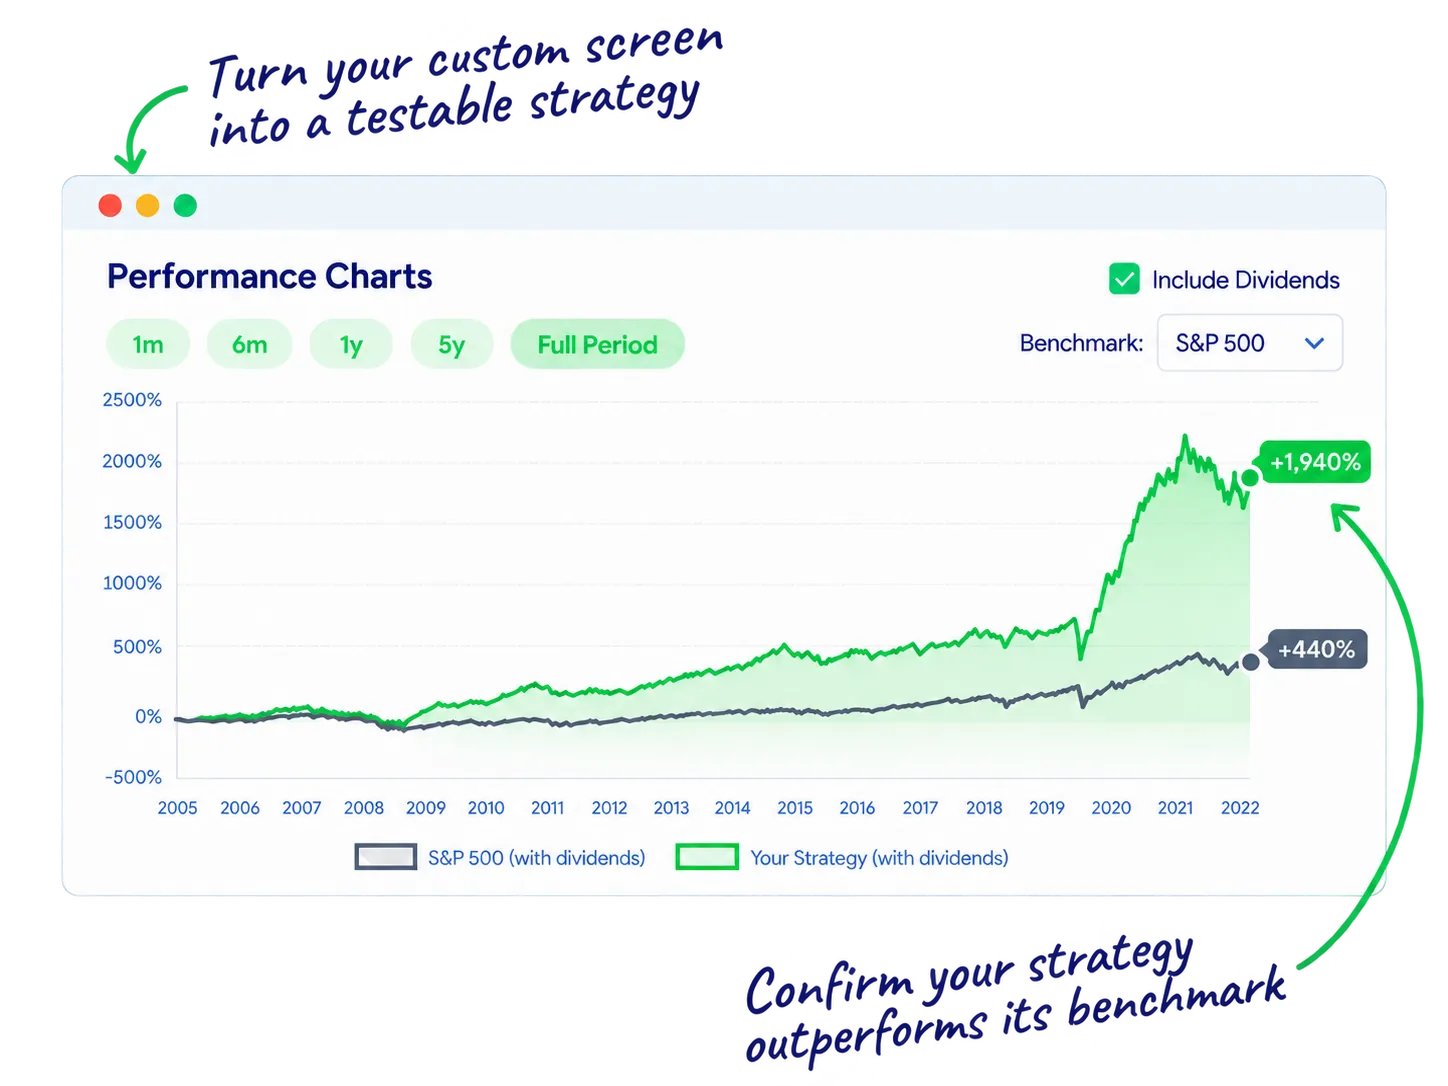
A financial analytics platform that turns your screen into a tested strategy. Build a screener, backtest it over 20+ years, and get a full visual report.

  • Build a screener from 4,000+ metrics
  • Backtest across 20+ years of data
  • Get charts for returns, drawdowns and risk
StockIntent backtest plotting a custom strategy against its benchmark to compare historical investment performance

Make Financial Data Easier to See, Understand, and Act On

Start your 7-day free trial and find quality compounders faster.

  • Access to all features
  • Free for 7 days
  • Cancel any time
Start 7-day free trial →
● ● ●Backtest · 18 years
+1,931%StockIntent Returns
+359%S&P 500 Returns
4.4xOutperformance
$2,030,989

— StockIntent Score ╌ S&P 500