Oct 27, 2026
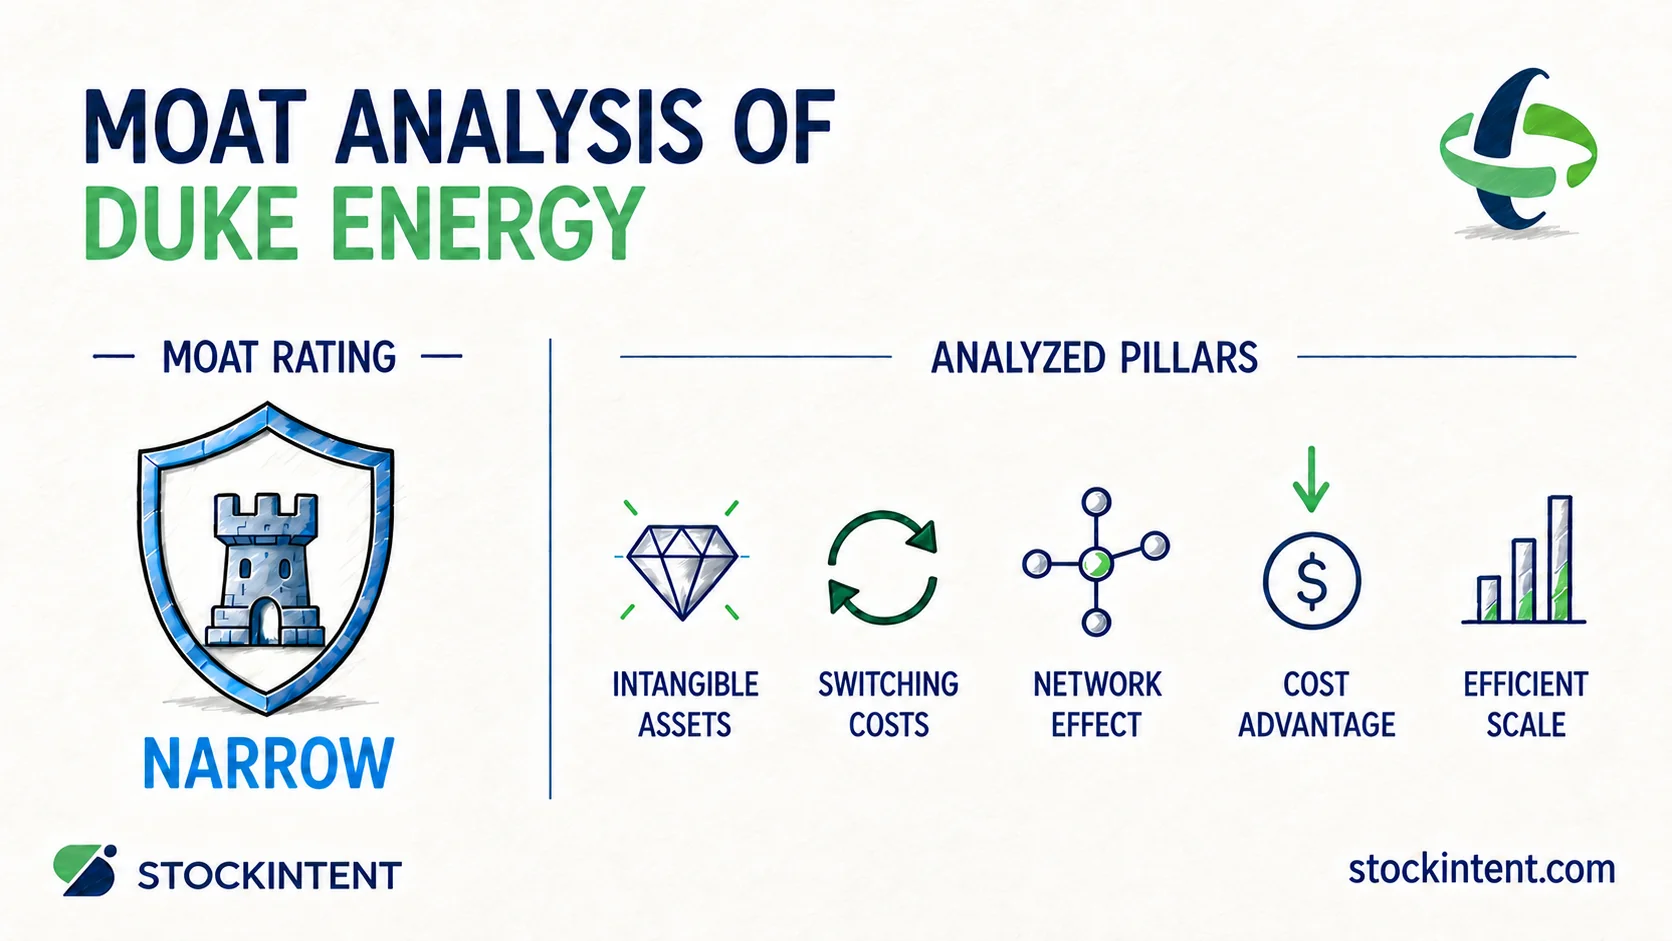
Duke Energy holds a narrow economic moat with a stable, slightly widening trend and medium uncertainty. Regulated monopoly service territories, an irreplaceable power grid, and franchise rights protect the business.
Duke Energy operates as a regulated electric and gas utility. It earns allowed returns on infrastructure added to its rate base, while state commissions set retail customer rates. The business serves about 8.7 million electric retail customers and 1.8 million natural gas customers, according to its 2026 proxy filing. Its five-year capital plan tops more than $103 billion for 2026-2030. This footprint spreads fixed infrastructure costs across millions of captive customers, forming the bedrock of the moat.
Here are our key takeaways:
A narrow moat matters because predictable returns often compound capital better than volatile spikes. Below, we examine each moat pillar, evaluate Duke's performance, assess the operational trend, and explain our uncertainty rating.
Duke's moat relies on legal and regulatory structures. Competitors cannot take its customers or undercut its prices. That dynamic shapes how the classic economic moat pillars apply to the company. Below, we rank each pillar from strongest to weakest.
Efficient scale represents the core of Duke's moat. Distributing electricity and gas functions as a natural monopoly. Running duplicate poles, wires, and substations through the same neighborhood makes no financial sense, so state regulators grant exclusive rights to one operator per area. A 2026 Moatscan analysis also views this pillar as very strong. A rival would have to spend billions rebuilding existing lines without any guarantee of winning customers.
Franchise rights, regulatory approvals, and statutory cost-recovery rules act as intangible assets. They give Duke an exclusive right to serve its territories. They also establish clear formulas to earn regulated returns on capital projects, assuming the company executes well. These protections come from state charters rather than commercial patents or brand loyalty. That origin explains why they last, even as regulators cap total profits.
Customers cannot switch to another local power or gas utility, which anchors baseline demand. The origin of that lock-in matters for investors.
Pro Insight: Duke's switching costs are territorial rather than behavioral. Customers stay because state laws give them no alternative wires provider. This statutory barrier differs from the voluntary switching costs seen with software platforms or consumer brands. The structure guarantees captive demand, but regulators limit what Duke earns on it.
Serving 8.7 million electric customers lets Duke spread corporate overhead across a broad base. Broad procurement and reliable bond market access also reduce borrowing costs relative to smaller peers. We view this edge as helpful support. Natural-monopoly protections defend the company far more than any stand-alone operational cost lead.
Network effects do not apply here. A power grid provides the same utility to a household regardless of how many neighbors connect to the line. As a result, this factor does not drive Duke's competitive position.
Efficient scale and franchise rights clearly anchor Duke's moat, while territorial lock-in and operational scale provide secondary support. The next step is evaluating whether this structure translates into actual financial results.
A regulated utility moat does not produce high profit margins. It yields steady allowed returns and rate-base expansion. The evidence in 2026 centers on two concrete points.
First, consider the North Carolina rate settlement. It granted a 9.8% allowed return on equity with a 53% equity structure, along with a multi-year rate framework. Regulators approved solid returns on capital for an essential, low-risk public service.
Second, earnings remain visible. Duke reaffirmed full-year 2026 adjusted EPS guidance of $6.55 to $6.80, pointing to a 5% to 7% annual growth target through 2030 in its Q2 2026 earnings release. Management expects retail rates to remain below the projected national average. That helps preserve constructive ties with regulators while capital spending ramps up.
This framework also brings real trade-offs. Duke cannot adjust consumer prices on its own, and operations cannot fully self-fund this expansion. A third-party Linevest analysis noted that capital expenditures reached $8.24 billion in the first half of 2026, compared to operating cash flow of $4.27 billion:
| H1 2026 | Amount |
|---|---|
| Capital expenditures | $8.24B |
| Operating cash flow | $4.27B |
Operating cash covered roughly half of capex during that period. Consequently, shareholder returns depend on timely rate relief and steady debt markets.
Duke's moat shows up through approved returns and steady earnings growth rather than standalone pricing power. Now we turn to whether that moat is expanding or under pressure.
We rate Duke's moat trend as stable, with a slight widening tilt. Growing electricity demand and heavy capital deployment reinforce its position as an incumbent. At the same time, rate caps limit how much extra profit Duke captures.
The expansion pipeline is substantial. On the Q2 2026 earnings call, management said Duke is on track to add 15 GW of generation capacity by 2031, backed by its Florida site plan. The company deploys over $1 billion each month into plants and grid infrastructure, according to its Q2 2026 investor slides. Surging demand from data centers and manufacturing facilities favors incumbents with established rights-of-way.
We stop short of calling the moat outright widening because larger spending plans introduce operational friction. Heavy outlays require extra regulatory approvals, add interest expense, and raise execution risks. Cost overruns or strict rate orders can expand the physical asset base without producing higher shareholder returns.
We track four main indicators over the next three to five years:
We review these trends through company filings, earnings transcripts, and regulatory dockets. Then we check how they affect fundamentals using StockIntent watchlists to monitor revenue growth and operating margins.
With the trend holding steady, the remaining task is evaluating our overall conviction. That brings us to our uncertainty rating.
We assign a medium uncertainty rating. This score measures the range of plausible future operational outcomes rather than short-term stock swings.
Several factors keep that range manageable. Regulated demand avoids the severe boom-and-bust cycles seen in cyclical industrial sectors. Management reaffirmed full-year 2026 adjusted EPS guidance of $6.55 to $6.80, supported by the North Carolina rate settlement. Those factors provide reliable cash flow visibility.
Other elements widen the range of outcomes. A Webull news summary reports that corporate debt stands near $82 billion while Duke targets a 14.5% FFO-to-debt ratio for 2026. The company uses asset sales and at-the-market equity programs to help fund the difference. Duke's 2026 regulatory disclosures also cite a South Carolina PSC rejection of its eRSA mechanism, a pending Duke Energy Progress rate review, and transmission allocation reviews at FERC.
Investors sometimes miss this dynamic by focusing only on power demand. For Duke, the primary risk involves capital conversion. It needs its $103 billion plan to earn allowed returns without running into financing hurdles. That challenge keeps our rating at medium.
Duke Energy holds a narrow moat, a stable-to-slightly-widening trend, and medium uncertainty. Its regional monopolies, critical grid assets, and legal franchises ensure steady demand. Regulators balance those advantages by capping overall investment yields.
Two variables will shape Duke's path from here. The first is whether heavy capital outlays convert into allowed returns through favorable rate decisions. The second is whether financing expenses eat into earnings while debt levels remain elevated.
We would reconsider our assessment if state regulators take a more restrictive stance or if execution stumbles. We do not expect either outcome today, but both warrant regular monitoring.
This content is for informational and educational purposes only and is not investment advice.
Start your 7-day free trial and find quality compounders faster.
— StockIntent Score ╌ S&P 500