Oct 25, 2026

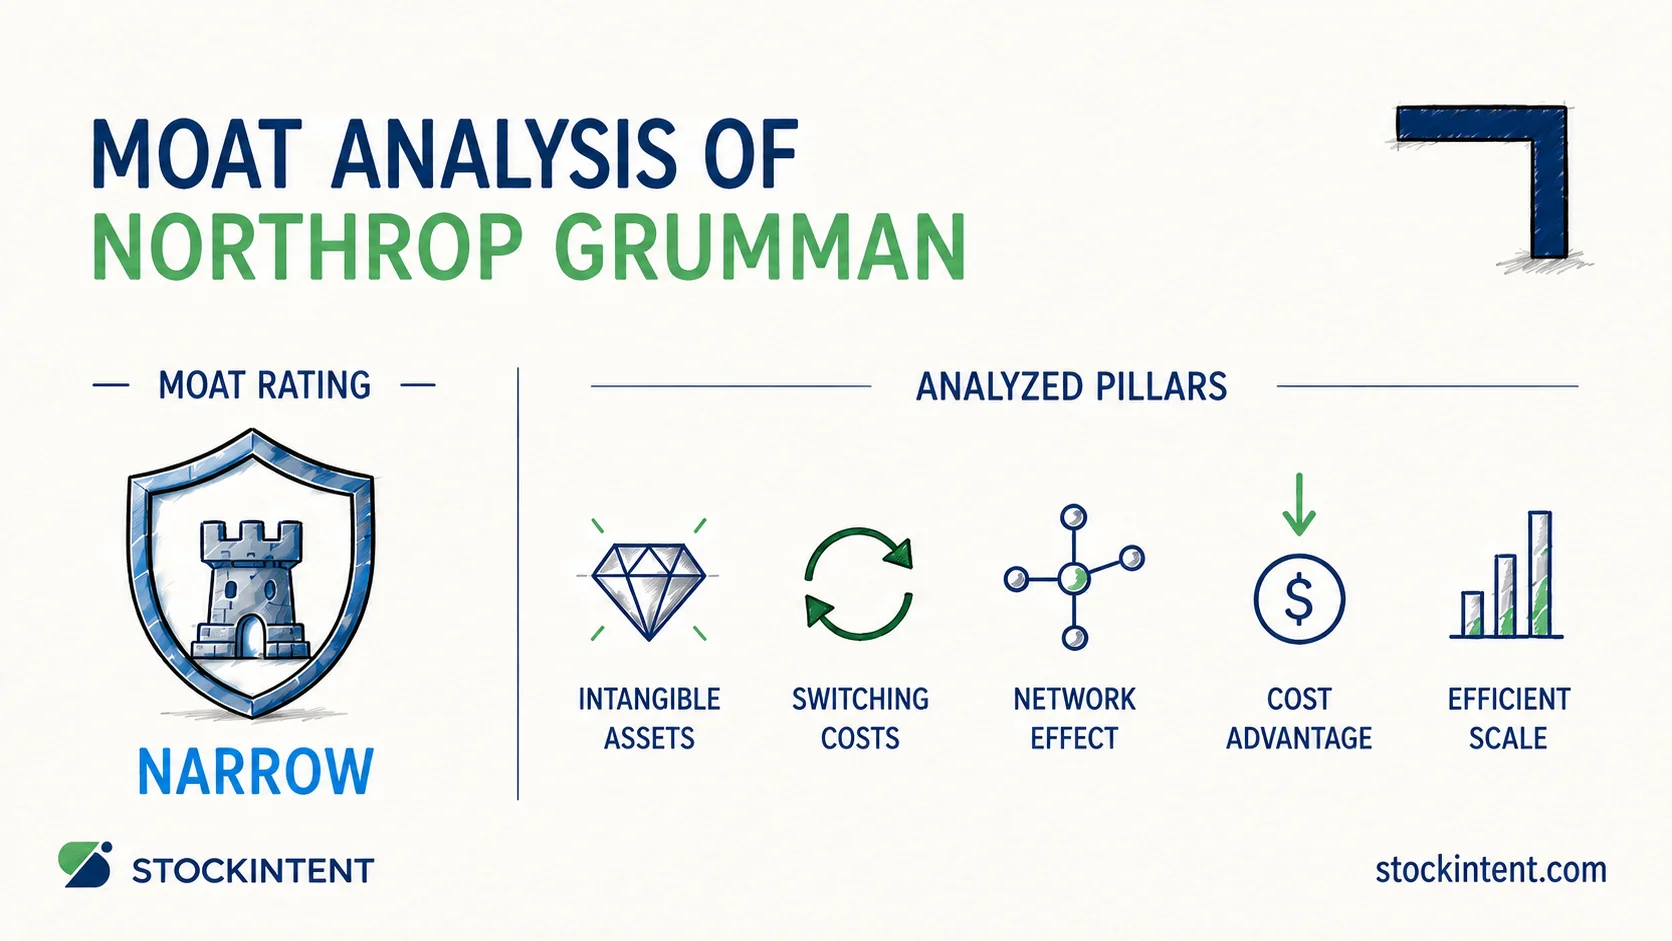
We rate Newmont's economic moat as narrow, with a stable trend and medium uncertainty. Its moat rests on efficient scale and intangible assets. As the world's largest gold producer, Newmont holds a reserve base that peers cannot easily replicate. Still, it operates as a price-taking commodity producer, which limits how wide that moat can grow.
The recent financials show strong cash generation. In Q2 2026, Newmont's realized gold price rose about 33% year over year while cost applicable to sales climbed just 4%. That gap expanded margins across the portfolio. The business also produced a record $7.3 billion in free cash flow in 2025.
Here are the central points of our view:
Moat durability matters because long-term returns depend on competitive advantages outlasting single-year commodity rallies. We evaluate Newmont's moat across five core pillars, check those traits against 2026 operational results, and assess our level of confidence in the business.
A gold miner's competitive edge looks very different from a software company's setup. Newmont sells an identical commodity into an open market, so standard tech moat pillars provide no shelter. Instead, the business relies on physical scale, resource life, and extraction costs. Here is how we assess each pillar in 2026:
| Pillar | Rating | One-line why |
|---|---|---|
| Efficient scale | Strong | World's largest gold producer with hard-to-replicate assets |
| Intangible assets | Moderate | 118 Moz reserves, long mine lives, operating know-how |
| Cost advantage | Moderate | Real discipline, but no proven durable cost lead |
| Network effects | Not relevant | Commodity product, no flywheel |
| Switching costs | Weak | Gold buyers face no lock-in to Newmont |
Scale provides Newmont's primary competitive shield. The company operates 12 managed sites worldwide and leads global gold output. Replicating this portfolio of large, long-life deposits in stable jurisdictions would take billions in capital and decades of work. That dynamic forms a barrier to entry, even if it cannot guarantee above-cost returns.
Newmont reported 118.2 million attributable gold ounces of reserves and 148.7 million ounces of resources at 2025 year-end. Its geological permits, long mine lives, and deep technical know-how carry clear strategic value. We rate these assets moderate rather than strong because mines deplete with every blast, and competitors can always buy other acreage.
Management focuses on cost cuts, but 2026 operational numbers show clear friction. Third-party research puts guided all-in sustaining costs around $1,680 per ounce, which sits near the upper end of senior gold peers. Some analysts also point out that exploration dollars are merely replacing mined ounces rather than expanding net reserves. Today's data does not point to a lasting cost lead.
Gold carries the same market value regardless of who pulls it from the ground. Buyers do not pay extra for Newmont bullion, and increased buyer volume creates no self-reinforcing utility.
Gold refiners and bullion desks can swap producers without paying friction fees. Because buyers have no structural loyalty to Newmont, the firm's margins depend on its place on the global cost curve rather than customer retention.
Large-scale extraction yields clear benefits in 2026. Newmont posted record quarterly earnings and free cash flow in Q1 2026. That liquidity pool lets management fund major mine expansions, service corporate debt, and buy back shares at the same time.
Yet much of that earnings growth stems from gold spot rates rather than proprietary advantages. High bullion prices raise top-line figures across the entire mining sector. We see clear commodity leverage here, but Newmont lacks individual pricing power.
Cost pressures also check this performance. Guided all-in sustaining costs near $1,680 per ounce rank among the highest of senior gold peers. Planned 2026 gold output trails 2025 levels, and exploration outlays mainly serve to maintain existing assets.
From our experience: Investors often confuse commodity tailwinds with durable moats. A wide operating margin during a gold rally demonstrates operating leverage. True competitive advantage in mining shows up through relative cost position, low-cost reserve replacement, and steady operational execution.
Peer comparisons illustrate this dynamic. Newmont leads peers in absolute revenue, reserves, and cash generation. At the same time, the market often awards Agnico Eagle a higher quality rating for execution. Newmont trades at a premium to Barrick and Kinross, but at a discount to Agnico. The moat shows up in size, not in margin efficiency.
We rate Newmont's moat trend as stable. Balance sheet gains offset near-term operational snags, leaving the structural position steady.
Development projects offer potential upside. Newmont is progressing Tanami Expansion 2, the Cadia Panel Caves, and the Lihir mine-life extension. Delivering these projects on schedule would extend operating lives and lift production back toward 6 million ounces per year. Fitch cited in its June 2026 affirmation of Newmont's A- rating with a Stable outlook that Newmont's scale supports its credit profile, confirming that the asset base remains fundamentally sound.
Operational headwinds balance that potential. Newmont guided to roughly 5.3 million attributable gold ounces in 2026, which sits below its 6 Moz run rate. Unit costs rose due to mine sequencing, higher royalties, and shifted maintenance work. Sustaining capital should reach roughly $1.95 billion this year, mostly in the second half. Investors also face joint venture disputes, including a notice of default tied to Nevada Gold Mines and technical delays at Red Chris.
Our research focuses on several operational markers over the coming years:
Investors can follow these metrics directly in corporate filings and earnings updates with a StockIntent watchlist.
We assign Newmont an uncertainty rating of medium. This grade measures the spread of realistic operational outcomes over the next three to five years rather than daily stock volatility. We believe that range is moderately wide.
Revenue projections reflect both volume and price risks. Newmont expects about 5.3 million attributable gold ounces in 2026, and consensus estimates target around $6.0 billion of revenue for the next quarter. While volume targets are clear, spot gold swings can disrupt cash flow quickly. The company missed revenue estimates in Q2 2026 despite supportive gold prices.
Capital timing adds further variability. Sustaining capital expenses of $1.95 billion are concentrated in the latter half of the year. Project delays, grade variation, and local permitting requirements can also alter free cash flow targets.
Strong balance sheet health keeps our uncertainty score at medium rather than high. S&P's September 2026 update noted that solid free cash flow supports leverage metrics, even with adjusted EBITDA expected to fall through 2028. Global scale provides a floor for operations, while commodity price swings create financial variance.
Newmont earns a narrow moat rating with a stable trend and medium uncertainty. World-class scale and 118.2 million ounces of gold reserves protect the franchise. However, elevated unit costs and softer 2026 production volumes keep us from rating the moat any higher.
Two variables will determine future performance. First, Newmont must demonstrate whether it can return to 6 million ounces of annual output while reducing its all-in sustaining costs. Second, it needs to replace depleted ounces at economical rates. Lowering unit costs alongside project delivery would reinforce the moat, while ongoing cost inflation would weaken it.
High gold prices can easily hide underlying cost challenges. While reported cash flows look strong today, investors should assess Newmont by its cost curve and project execution rather than peak gold receipts.
This analysis is for informational and educational purposes only and does not constitute investment advice.
Start your 7-day free trial and find quality compounders faster.
— StockIntent Score ╌ S&P 500