RTX Economic Moat Analysis: Rating, Trend & Competitive Advantages

RTX Economic Moat Analysis: Rating, Trend & Competitive Advantages

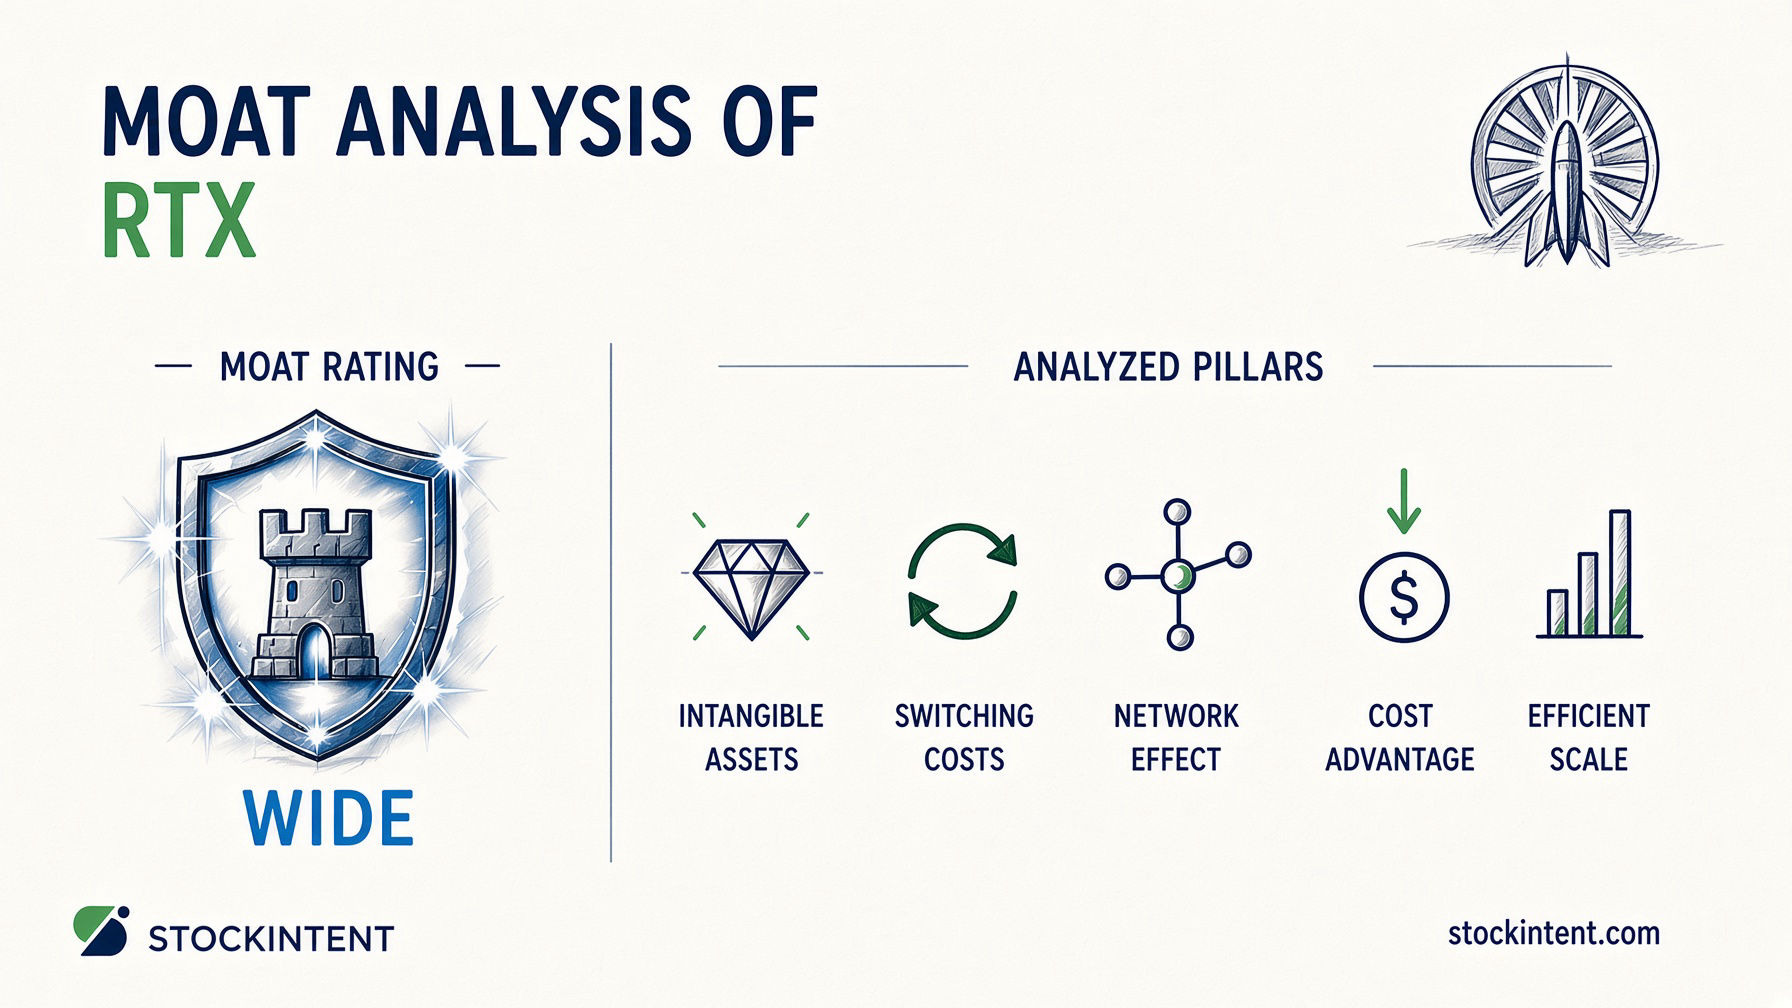
RTX holds a Wide economic moat, with a Widening trend and Medium uncertainty. That verdict rests on a $289 billion backlog, proprietary defense platforms, and expanding margins. But execution risks, especially in Pratt & Whitney engines, keep the confidence level tempered.

Here's what matters most at a glance:

The durability of this defense and aerospace franchise depends on converting that record backlog into actual cash flow. Management's 2026 guidance calls for $92 billion to $93 billion in adjusted sales, 5% to 6% organic growth, and $8.25 billion to $8.75 billion in free cash flow. Whether RTX hits those targets, and whether margins keep expanding, will determine if the widening trend persists or stalls.

RTX's Competitive Advantages

RTX's competitive position rests on three pillars that genuinely matter: switching costs, intangible assets, and efficient scale. Cost advantage plays a supporting role. Network effects? They're practically nonexistent here. Here is the detailed breakdown.

Switching costs: strong. Once RTX's systems are baked into a defense program, customers face enormous friction to change suppliers mid-contract. The $289 billion backlog isn't just a number on a slide. It represents multi-year commitments where switching would require re-qualification, re-certification, and unacceptable mission risk. Military procurement officers don't casually swap missile suppliers because they found a better deal on page twelve of a vendor brochure.

Intangible assets: strong. The 2025 Annual Report and recent 10-K filings highlight proprietary technology, engineering know-how, and program-specific capabilities in Patriot, NASAMS, and LTAMDS. These aren't patents you can engineer around in a weekend. They're decades of classified development, cleared workforce expertise, and sole-source certifications that competitors cannot replicate quickly, if at all.

Pro Insight: In our experience, investors often dismiss defense contractors as "no moat" businesses due to government customer concentration alone. RTX's $289 billion backlog and proprietary defense platforms like Patriot and NASAMS tell a different story: the combination of mission-critical switching costs and regulatory barriers creates incumbency that rivals cannot easily replicate, even if headline ROIC appears moderate compared to asset-light software companies.

When reviewing the complete financial picture to test these durability claims, we look for whether segment margins and returns on capital actually reflect the pricing power these intangible assets should provide.

Efficient scale: moderate to strong. Defense and aerospace markets favor incumbents because they're expensive to enter, heavily regulated, and require years of qualification. A startup cannot just decide to build precision munitions next quarter. RTX's installed base across thousands of aircraft and hundreds of defense platforms reinforces this structural barrier.

Cost advantage: moderate. Scale and productivity initiatives like the CORE program create some operating leverage. But RTX is investing heavily in capacity expansion rather than simply harvesting a structural low-cost position. The cost edge is real but secondary to customer captivity and proprietary technology.

Network effects: weak. In our opinion network effects are not material to RTX's business model. More Patriot missile users don't make each individual missile more valuable to existing customers. This isn't a platform business, and that's fine. Not every durable company needs network effects.

The quality-over-cheapness principle applies directly here. RTX's moat durability comes from stranded customers, protected technology, and regulated scale, not from being the lowest bidder today. Investors evaluating business quality should weigh whether these advantages can sustain excess returns for years, not whether the stock screens cheap on next year's earnings.

Why the Moat Matters: How It Shows Up in Business Performance

RTX's competitive advantages translate most visibly into revenue visibility and cash flow conversion, not just into flashy margins. The $289 billion backlog, split across $170 billion in commercial aerospace and $119 billion in defense, functions as a multi-year contract vault. That visibility is the moat's strongest financial signature.

The operating evidence is equally telling. In Q2 2026, RTX delivered 14% reported sales growth and 16% organic growth, with consolidated segment margins expanding by roughly 40 basis points. Management's 2026 free cash flow guidance of $8.25 billion to $8.75 billion shows the backlog is converting into actual cash.

Yet the moat's limits appear when you look at returns. Net margins around 8% and return on invested capital in the mid-single digits indicate a durable franchise, not an exceptional one. RTX compounds through reliability and reinvestment runway rather than through outsized profitability. The $289 billion backlog provides the capacity to reinvest; whether management deploys that capital wisely determines how much long-term value gets created.

From our perspective, the critical question isn't whether the moat exists. It's whether the financial performance justifies the durability story. Backlog growth and margin expansion say yes. ROIC levels suggest the advantage is real but not towering.

Moat Trend: What Could Strengthen or Weaken the Moat?

RTX's moat is widening in 2026, driven by record demand conversion and a structural shift in how customers buy aerospace and defense services. This isn't merely a cyclical uptick. The evidence points to deeper customer entrenchment and improved monetization of RTX's competitive position.

The backlog trajectory tells the clearest story. RTX reported $289 billion in backlog as of Q2 2026, up 22% year over year from $271 billion earlier in the year. That $18 billion acceleration in a single quarter signals something beyond normal order flow. Management raised full-year 2026 guidance to $92 billion to $93 billion in adjusted sales after Q2, confirming that demand is translating into deliverable revenue rather than speculative pipeline.

The conversion metrics are equally striking. Q2 2026 produced a book-to-bill ratio of approximately 2.4, meaning RTX booked $2.40 in new orders for every $1 of revenue recognized. Raytheon alone generated nearly $20 billion in bookings during the quarter, with over $10 billion in international defense awards in the first half of 2026. This pace suggests RTX is gaining share in competitive programs, not merely riding industry-wide spending growth.

So here's where it gets interesting. From our experience following aerospace and defense cycles, backlog growth alone can mislead if execution falters. The critical signal is conversion: RTX's ability to turn that $289 billion into delivered revenue and margin expansion, evidenced by the 40 bps margin improvement in Q2, determines whether the moat is truly widening or merely filling with unfilled orders that strain operational capacity.

The industry structure reinforces this trend. Customer buying patterns are shifting decisively toward lifecycle support, repairs, and availability rather than initial equipment purchases alone. This favors incumbents with installed bases and deep maintenance relationships, a structural tailwind that strengthens recurring revenue and raises switching costs for defense and airline customers alike.

Looking ahead, four indicators will tell investors whether this widening trend persists or stalls:

  1. Backlog conversion rate: Is RTX delivering revenue and cash flow on schedule, or is the record backlog becoming an operational burden?
  2. Commercial aftermarket growth: Flight hours, fleet utilization, and maintenance intensity directly drive high-margin recurring revenue.
  3. Defense book-to-bill ratio: Sustained ratios above 1.0 signal continued competitive wins and share expansion.
  4. Free cash flow and margin expansion: These prove the moat is generating economic returns.

Execution risks remain real. Pratt & Whitney engine program challenges, supply chain constraints, or a slowdown in defense procurement could stall or reverse the trend. But as of mid-2026, the weight of evidence points toward a modestly widening moat, not a stable or contracting one.

Uncertainty Rating: How Confident Are We in This Moat Assessment?

Our uncertainty rating for RTX is Medium. The near-term revenue picture is remarkably clear thanks to the $289 billion backlog, but the range of outcomes over three to five years remains wider than the headline suggests. The question isn't whether demand exists. It's whether RTX can execute consistently across programs with very different risk profiles.

The predictability tension shows up in two places. First, Pratt & Whitney engine issues, service-shop throughput challenges, and shifts between installed engines and spares create genuine execution risk that could compress margins even when backlog is growing. Second-half comparisons are expected to slow, which means the Q2 margin expansion of roughly 40 basis points may not repeat evenly.

External risks add another layer. Geopolitical shifts can redirect defense priorities overnight. Export controls, procurement rules, and sanctions exposure affect international awards that topped $10 billion in the first half of 2026. Commercial aftermarket revenue, while recurring, still tracks flight hours and fleet utilization, which are not immune to economic softness or airline behavior changes.

The moat itself is durable in structure but execution-dependent in practice. RTX will likely remain a top-tier defense and aerospace franchise because its installed base, proprietary platforms, and regulatory barriers are genuinely hard to replicate. Yet the spread between a best-case and worst-case three-to-five-year outcome is meaningful. Engine program recovery, award timing, and supply-chain management could produce anything from sustained margin expansion to a mature industrial growth profile.

For investors, the practical approach is to organize key indicators into a watchlist and track them over time. Backlog conversion, aftermarket growth trajectory, defense book-to-bill ratios, and free cash flow generation are the signals that will tell you whether RTX's widening trend is holding or if execution risks are starting to dominate.

Bottom Line

RTX holds a Wide economic moat, a Widening trend, and Medium uncertainty. The $289 billion backlog, proprietary platforms like Patriot and NASAMS, and Q2 2026 margin expansion of roughly 40 basis points support this verdict. These advantages create genuine customer captivity and regulatory barriers that competitors cannot easily replicate.

What could change our view? Execution failures at Pratt & Whitney, a sustained collapse in defense spending, or an inability to convert backlog into free cash flow would each weaken the assessment. The moat is structural, but its rewards are not automatic.

For investors, the practical next step is monitoring four indicators: backlog conversion rates, commercial aftermarket growth, defense book-to-bill ratios, and free cash flow generation. These signals will validate whether the widening trend persists or if execution risks begin to dominate.

This content is for informational and educational purposes only and is not investment advice.

RTX holds a Wide economic moat, with a Widening trend and Medium uncertainty. That verdict rests on a $289 billion backlog, proprietary defense platforms, and expanding margins. But execution risks, especially in Pratt & Whitney engines, keep the confidence level tempered.

Here's what matters most at a glance:

The durability of this defense and aerospace franchise depends on converting that record backlog into actual cash flow. Management's 2026 guidance calls for $92 billion to $93 billion in adjusted sales, 5% to 6% organic growth, and $8.25 billion to $8.75 billion in free cash flow. Whether RTX hits those targets, and whether margins keep expanding, will determine if the widening trend persists or stalls.

RTX's Competitive Advantages

RTX's competitive position rests on three pillars that genuinely matter: switching costs, intangible assets, and efficient scale. Cost advantage plays a supporting role. Network effects? They're practically nonexistent here. Here is the detailed breakdown.

Switching costs: strong. Once RTX's systems are baked into a defense program, customers face enormous friction to change suppliers mid-contract. The $289 billion backlog isn't just a number on a slide. It represents multi-year commitments where switching would require re-qualification, re-certification, and unacceptable mission risk. Military procurement officers don't casually swap missile suppliers because they found a better deal on page twelve of a vendor brochure.

Intangible assets: strong. The 2025 Annual Report and recent 10-K filings highlight proprietary technology, engineering know-how, and program-specific capabilities in Patriot, NASAMS, and LTAMDS. These aren't patents you can engineer around in a weekend. They're decades of classified development, cleared workforce expertise, and sole-source certifications that competitors cannot replicate quickly, if at all.

Pro Insight: In our experience, investors often dismiss defense contractors as "no moat" businesses due to government customer concentration alone. RTX's $289 billion backlog and proprietary defense platforms like Patriot and NASAMS tell a different story: the combination of mission-critical switching costs and regulatory barriers creates incumbency that rivals cannot easily replicate, even if headline ROIC appears moderate compared to asset-light software companies.

When reviewing the complete financial picture to test these durability claims, we look for whether segment margins and returns on capital actually reflect the pricing power these intangible assets should provide.

Efficient scale: moderate to strong. Defense and aerospace markets favor incumbents because they're expensive to enter, heavily regulated, and require years of qualification. A startup cannot just decide to build precision munitions next quarter. RTX's installed base across thousands of aircraft and hundreds of defense platforms reinforces this structural barrier.

Cost advantage: moderate. Scale and productivity initiatives like the CORE program create some operating leverage. But RTX is investing heavily in capacity expansion rather than simply harvesting a structural low-cost position. The cost edge is real but secondary to customer captivity and proprietary technology.

Network effects: weak. In our opinion network effects are not material to RTX's business model. More Patriot missile users don't make each individual missile more valuable to existing customers. This isn't a platform business, and that's fine. Not every durable company needs network effects.

The quality-over-cheapness principle applies directly here. RTX's moat durability comes from stranded customers, protected technology, and regulated scale, not from being the lowest bidder today. Investors evaluating business quality should weigh whether these advantages can sustain excess returns for years, not whether the stock screens cheap on next year's earnings.

Why the Moat Matters: How It Shows Up in Business Performance

RTX's competitive advantages translate most visibly into revenue visibility and cash flow conversion, not just into flashy margins. The $289 billion backlog, split across $170 billion in commercial aerospace and $119 billion in defense, functions as a multi-year contract vault. That visibility is the moat's strongest financial signature.

The operating evidence is equally telling. In Q2 2026, RTX delivered 14% reported sales growth and 16% organic growth, with consolidated segment margins expanding by roughly 40 basis points. Management's 2026 free cash flow guidance of $8.25 billion to $8.75 billion shows the backlog is converting into actual cash.

Yet the moat's limits appear when you look at returns. Net margins around 8% and return on invested capital in the mid-single digits indicate a durable franchise, not an exceptional one. RTX compounds through reliability and reinvestment runway rather than through outsized profitability. The $289 billion backlog provides the capacity to reinvest; whether management deploys that capital wisely determines how much long-term value gets created.

From our perspective, the critical question isn't whether the moat exists. It's whether the financial performance justifies the durability story. Backlog growth and margin expansion say yes. ROIC levels suggest the advantage is real but not towering.

Moat Trend: What Could Strengthen or Weaken the Moat?

RTX's moat is widening in 2026, driven by record demand conversion and a structural shift in how customers buy aerospace and defense services. This isn't merely a cyclical uptick. The evidence points to deeper customer entrenchment and improved monetization of RTX's competitive position.

The backlog trajectory tells the clearest story. RTX reported $289 billion in backlog as of Q2 2026, up 22% year over year from $271 billion earlier in the year. That $18 billion acceleration in a single quarter signals something beyond normal order flow. Management raised full-year 2026 guidance to $92 billion to $93 billion in adjusted sales after Q2, confirming that demand is translating into deliverable revenue rather than speculative pipeline.

The conversion metrics are equally striking. Q2 2026 produced a book-to-bill ratio of approximately 2.4, meaning RTX booked $2.40 in new orders for every $1 of revenue recognized. Raytheon alone generated nearly $20 billion in bookings during the quarter, with over $10 billion in international defense awards in the first half of 2026. This pace suggests RTX is gaining share in competitive programs, not merely riding industry-wide spending growth.

So here's where it gets interesting. From our experience following aerospace and defense cycles, backlog growth alone can mislead if execution falters. The critical signal is conversion: RTX's ability to turn that $289 billion into delivered revenue and margin expansion, evidenced by the 40 bps margin improvement in Q2, determines whether the moat is truly widening or merely filling with unfilled orders that strain operational capacity.

The industry structure reinforces this trend. Customer buying patterns are shifting decisively toward lifecycle support, repairs, and availability rather than initial equipment purchases alone. This favors incumbents with installed bases and deep maintenance relationships, a structural tailwind that strengthens recurring revenue and raises switching costs for defense and airline customers alike.

Looking ahead, four indicators will tell investors whether this widening trend persists or stalls:

  1. Backlog conversion rate: Is RTX delivering revenue and cash flow on schedule, or is the record backlog becoming an operational burden?
  2. Commercial aftermarket growth: Flight hours, fleet utilization, and maintenance intensity directly drive high-margin recurring revenue.
  3. Defense book-to-bill ratio: Sustained ratios above 1.0 signal continued competitive wins and share expansion.
  4. Free cash flow and margin expansion: These prove the moat is generating economic returns.

Execution risks remain real. Pratt & Whitney engine program challenges, supply chain constraints, or a slowdown in defense procurement could stall or reverse the trend. But as of mid-2026, the weight of evidence points toward a modestly widening moat, not a stable or contracting one.

Uncertainty Rating: How Confident Are We in This Moat Assessment?

Our uncertainty rating for RTX is Medium. The near-term revenue picture is remarkably clear thanks to the $289 billion backlog, but the range of outcomes over three to five years remains wider than the headline suggests. The question isn't whether demand exists. It's whether RTX can execute consistently across programs with very different risk profiles.

The predictability tension shows up in two places. First, Pratt & Whitney engine issues, service-shop throughput challenges, and shifts between installed engines and spares create genuine execution risk that could compress margins even when backlog is growing. Second-half comparisons are expected to slow, which means the Q2 margin expansion of roughly 40 basis points may not repeat evenly.

External risks add another layer. Geopolitical shifts can redirect defense priorities overnight. Export controls, procurement rules, and sanctions exposure affect international awards that topped $10 billion in the first half of 2026. Commercial aftermarket revenue, while recurring, still tracks flight hours and fleet utilization, which are not immune to economic softness or airline behavior changes.

The moat itself is durable in structure but execution-dependent in practice. RTX will likely remain a top-tier defense and aerospace franchise because its installed base, proprietary platforms, and regulatory barriers are genuinely hard to replicate. Yet the spread between a best-case and worst-case three-to-five-year outcome is meaningful. Engine program recovery, award timing, and supply-chain management could produce anything from sustained margin expansion to a mature industrial growth profile.

For investors, the practical approach is to organize key indicators into a watchlist and track them over time. Backlog conversion, aftermarket growth trajectory, defense book-to-bill ratios, and free cash flow generation are the signals that will tell you whether RTX's widening trend is holding or if execution risks are starting to dominate.

Bottom Line

RTX holds a Wide economic moat, a Widening trend, and Medium uncertainty. The $289 billion backlog, proprietary platforms like Patriot and NASAMS, and Q2 2026 margin expansion of roughly 40 basis points support this verdict. These advantages create genuine customer captivity and regulatory barriers that competitors cannot easily replicate.

What could change our view? Execution failures at Pratt & Whitney, a sustained collapse in defense spending, or an inability to convert backlog into free cash flow would each weaken the assessment. The moat is structural, but its rewards are not automatic.

For investors, the practical next step is monitoring four indicators: backlog conversion rates, commercial aftermarket growth, defense book-to-bill ratios, and free cash flow generation. These signals will validate whether the widening trend persists or if execution risks begin to dominate.

This content is for informational and educational purposes only and is not investment advice.