Oct 10, 2026
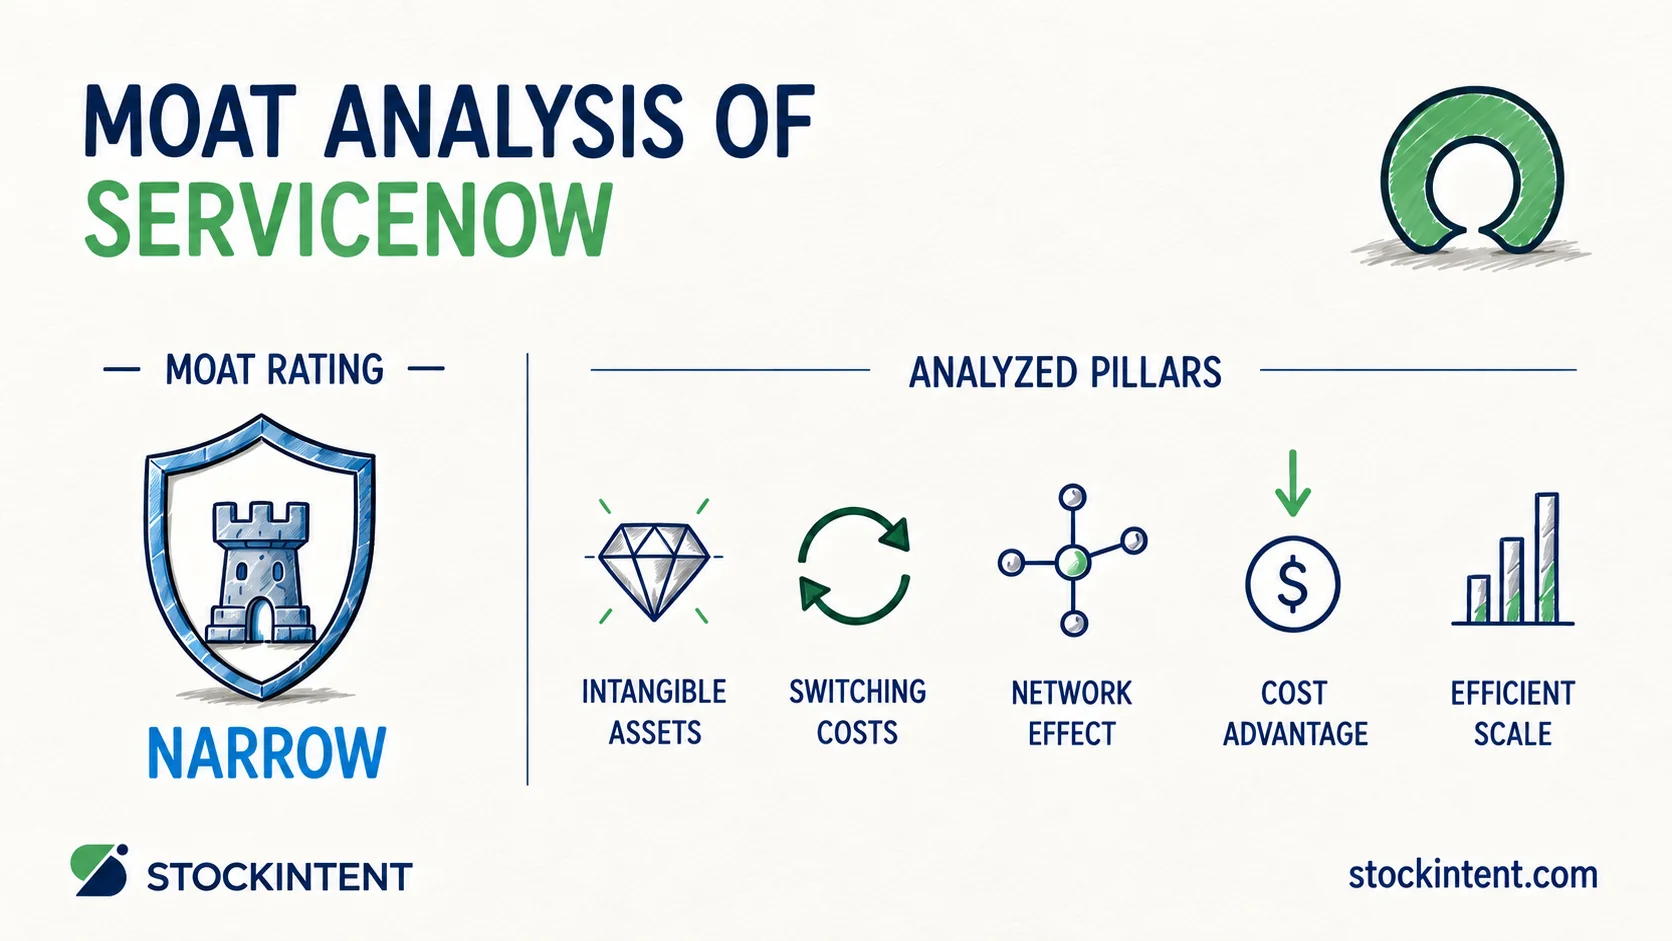
We assign ServiceNow a narrow moat rating, paired with a stable trend and medium uncertainty. The foundation of that moat comes down to switching costs from deeply embedded enterprise workflows. A large partner network and specialized platform know-how help support that position.
Financial metrics reflect that customer lock-in clearly. ServiceNow posted a 98% renewal rate in Q2 2026, staying within its typical 97% to 98% range, according to its Q2 2026 investor presentation. During that same period, subscription revenue grew 23% year over year in constant currency.
Here are our main takeaways:
Moat durability helps convert steady sales into compounding returns over time. Below, we review each competitive pillar against the operating data before examining the business trend and outlook.
We rank ServiceNow's five moat pillars from strongest to weakest: switching costs (Strong), network effects (Moderate), intangible assets (Moderate), cost advantage (Weak), and efficient scale (not material). Two pillars generate most of the durability. The rest add limited defensive value.
The Now Platform manages critical workflows for thousands of enterprise clients. Swapping out the system requires retraining employees, rewriting code, and weathering business downtime. A 2026 University of Iowa analysis estimates ITSM migration expenses run between $500,000 and $2 million per enterprise customer. Those costs explain why renewal rates remain near 98% and why clients expand existing contracts instead of shopping for alternatives.
Pro Insight: ServiceNow's moat is often attributed to AI features or market reputation. In our view, high switching costs drive this business. Clients stay because removing the software disrupts day-to-day operations. AI tools sit on top of that customer lock-in rather than generating it.
ServiceNow benefits from an ecosystem flywheel rather than a pure network effect. Per ServiceNow's 2026 partner program announcement, the company works with over 2,700 global partners. Independent developers make the catalog more capable, which helps draw in additional clients. That creates steady value, but it still plays second fiddle to switching costs.
Years of proprietary workflow designs, enterprise security compliance, and platform architecture prove difficult for new entrants to copy. These advantages center on technical execution and delivery expertise rather than formal patents or brand equity. For that reason, we rate intangible assets as Moderate.
While ServiceNow helps its customers cut back-office expenses, the firm itself does not hold a clear structural operating cost advantage over peer software vendors. We see no lasting cost edge in its filings.
Efficient scale occurs when a target addressable market can sustain only a handful of profitable firms. Enterprise workflow automation remains a growing, contested space with room for several large providers. Efficient scale does not explain ServiceNow's competitive position.
For long-term investors, the real test is whether these pillars protect returns over time. We look at how those advantages appear in the company's financial results next.
Three pillars drive ServiceNow's position: high switching costs, partner expansion, and deep platform know-how. We want to see those traits directly in the income statement. The business displays them through consistent contract expansions, pricing gains, and healthy forward bookings.
Large accounts demonstrate the strength of these switching costs. In Q2 2026, ServiceNow counted 658 customers generating over $5 million in annual contract value, up from 533 clients a year earlier. That represents roughly 23% annual growth among its most deeply integrated users.
Pricing power shows up across product tiers as well. During the Q2 2026 earnings call, executives noted that ProPlus SKU pricing saw uplifts over 30%, while newer AI SKUs carried 20% to 30% premiums. Clients accepted these rate increases without leaving. We view this as useful early evidence, though long-term AI monetization remains an open question.
Forward visibility remains solid. Current remaining performance obligations reached $12.64 billion in Q1 2026, climbing 22.5% year over year. In addition, CSIMarket's Q2 2026 data showed ServiceNow grew revenue 24.01% year over year, compared with 15.17% for its competitor group.
We do note that ServiceNow lacks a verified structural margin advantage over rival platforms. Some recent operating gains stemmed from hiring pacing and project timing rather than fundamental operating leverage. That balance brings us to our trend analysis.
We view the moat trend as stable. Core product usage continues to widen inside enterprise accounts, but competitors are challenging specific modules more aggressively. These two dynamics balance each other out today.
On the positive side, clients keep buying broader software bundles. According to Business Model Analyst's 2026 report, 91% of ServiceNow's 2025 net new annual contract value came from deals spanning five or more products. AI tools supply additional momentum. Company management stated that AI contract value topped $1 billion by Q2 2026, aiming for $1.5 billion by year-end, based on the Q2 2026 earnings call transcript. When customers adopt Now Assist and renew contracts, switching barriers rise.
Competitive pressure comes from single-purpose alternatives. Redress Compliance's 2026 analysis points out that while ServiceNow leads the broad enterprise category, competitors like Microsoft, Salesforce, Atlassian, Freshworks, and BMC contest individual ITSM deals. Consumption-based AI pricing models also encourage buyers to inspect their software bills closely. ServiceNow still holds about 40% of the ITSM market with 8,600 category clients per The Register, but competitors continue to fight for those budgets.
We track four core indicators to assess the moat's trajectory:
These operational shifts influence long-term top-line growth and free cash flow generation. You can monitor these operational figures using a StockIntent watchlist as earnings reports come out.
We place ServiceNow at a Medium uncertainty rating. This score measures the range of likely operational outcomes over the next three to five years rather than daily share price swings.
Several factors provide stability. In Q2 2026, non-GAAP operating margin reached 29.5%, topping internal projections by 300 basis points, with full-year operating margin expected near 31.5%. Management also guided for 21% constant-currency subscription growth and maintained a 35% free cash flow margin outlook, per the Q2 2026 earnings call. High subscription revenue helps cushion business downside relative to other tech vendors.
Other metrics point to emerging cost pressures. Subscription gross margins fell to 80.5% in Q2 2026 from 83.0% in the prior-year quarter. Management attributed that drop to higher compute costs from AI and cloud hosting. The Armis acquisition also adds FY2026 margin drags of 25 basis points for subscription gross margin, 75 basis points for operating margin, and 200 basis points for free cash flow margin. Deal delays in the Middle East during Q1 highlight regional risks as well.
Our Medium rating reflects the uncertain trajectory of enterprise AI. If generative tools increase customer retention without hurting margins, the business case solidifies. If AI features raise infrastructure costs without boosting contract sizes, overall profitability will compress.
Our evaluation remains consistent: a narrow moat, a stable trend, and medium uncertainty. ServiceNow's competitive moat rests on customer switching costs, reinforced by high retention figures and multi-product account growth.
Two variables will decide the company's trajectory. First, whether new AI features expand existing switching costs or increase computing overhead without durable pricing power. Second, whether module-level competitors start pulling customers away from full platform migrations.
We will update our moat view if those factors shift. For now, watch cohort renewal figures, multi-product deal sizes, and AI renewal uptake during quarterly earnings calls. Those indicators will show whether the moat remains protected.
This content is for informational and educational purposes only and is not investment advice.
Start your 7-day free trial and find quality compounders faster.
— StockIntent Score ╌ S&P 500