A business that grows sales 28% year after year normally gets more expensive. AppLovin just got cheaper. A lot cheaper.
Sales rose 28.52% over the last year. Net margins expanded to 64.58%. Free cash flow per share climbed from about $1 to about $13.50 in under five years. Yet the stock trades roughly 56% below highs it set not so long ago.
Whenever the price and the underlying business disagree by that much, we get interested.
By the end of this you'll have a deep fundamental analysis of AppLovin. More than that, you'll have a repeatable way to read any company fundamentals.
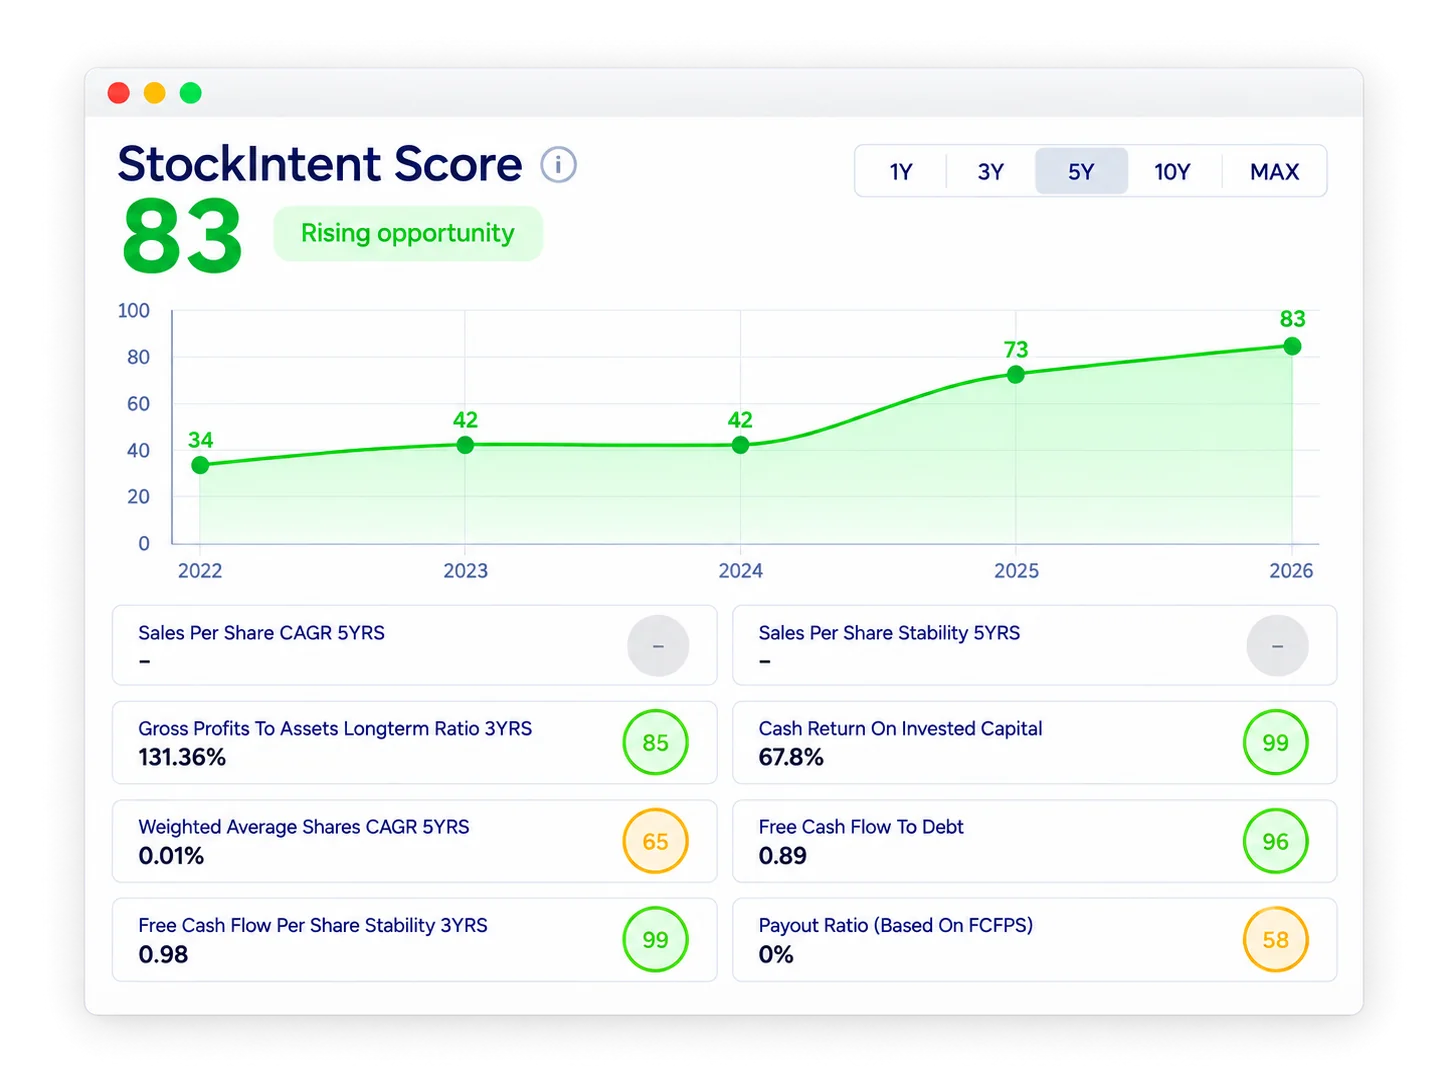
AppLovin scores 83 out of 100 on our proprietary StockIntent Score.
That number is built from eight fundamental measures of the business, rolled up into a single 0-100 score. Higher is better. The score is the fast read, and the eight metrics underneath it are the transparent reasoning.
The pace at which this company is improving its fundamentals is astonishing. In just five years the score expanded from 34 to 83. A business that climbs that far, that fast, didn't get lucky in one quarter. That climb hints at a real compounding story.
But before any of it makes sense, we need to understand why these eight metrics and not eight others.
In his 1986 letter to Berkshire shareholders, Warren Buffett put a definition in the appendix that most investors skip. He called it owner earnings.
Plain version: it's the cash a business could hand its owners each year after paying for everything it needs to stay exactly as competitive as it is today. Not reported profit. Reported profit includes charges that cost nobody anything, and it leaves out spending the business genuinely has to do.
Charlie Munger pushed him one step further. Early Buffett bought cheap businesses. Munger argued that a wonderful business at a fair price beats a fair business at a wonderful price. Quality became the filter. Price became a question of timing.
Then came the hard part: sitting on your hands.
Buffett and Munger rejected almost everything that crossed their desks, sometimes waiting years for the few that cleared the bar.
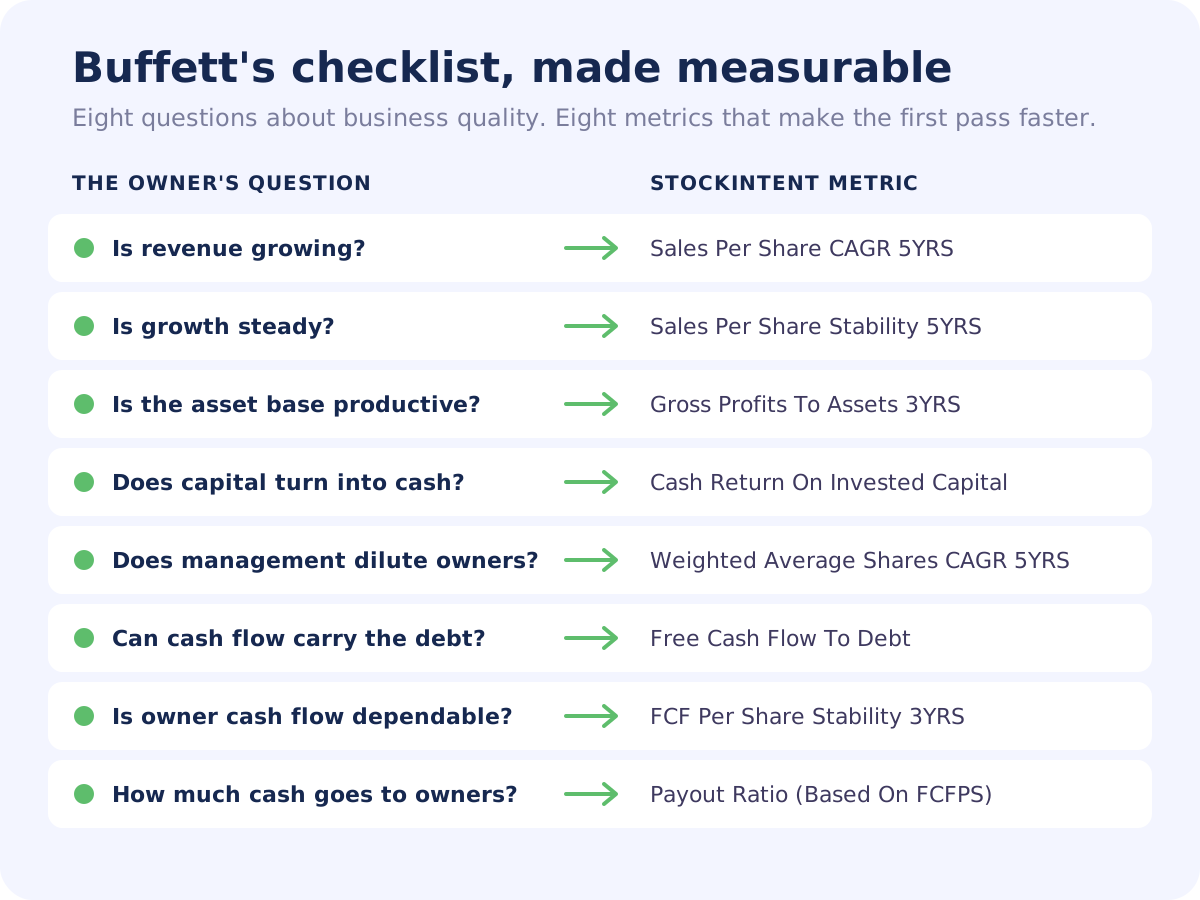
So what does that bar look like? That is where the eight metrics come into play:
Growing, cash-generative, stable, efficient, solvent, and run by people who treat your capital well. That is close to how Buffett would describe a wonderful business.
The StockIntent score acts as a quick filter. It tells you which companies deserve your time, so you can spend it where it actually pays: digging into the moat, skimming earnings calls, judging whether management has the right integrity.
The part of the Buffett story that gets skipped is the part that matters most to you.
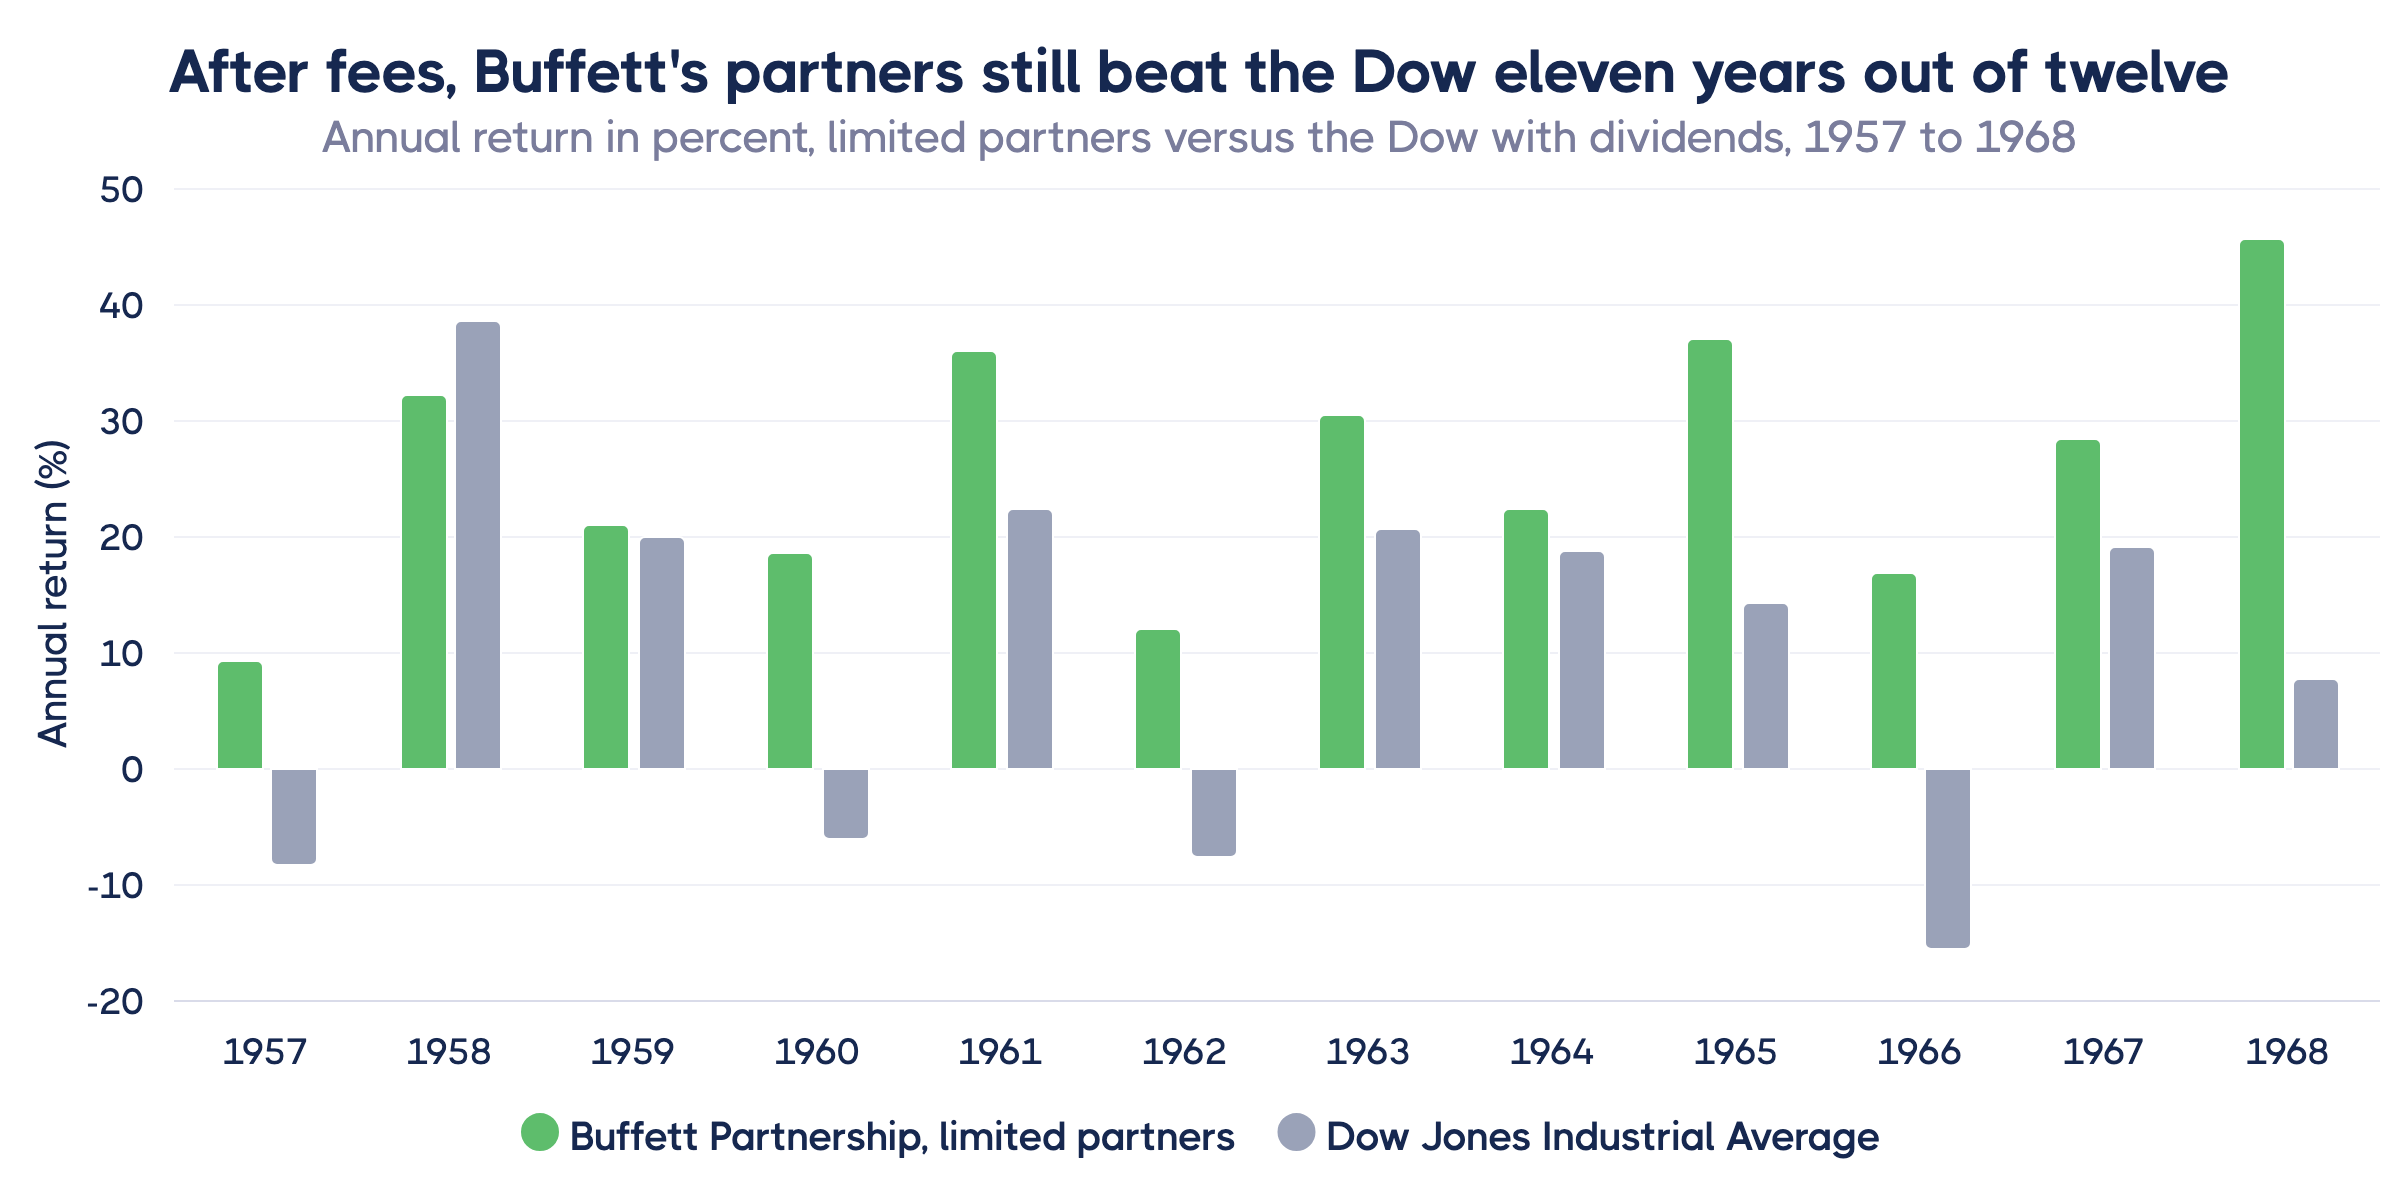
Before Berkshire, Buffett ran a partnership. From 1957 to 1968, his limited partners compounded at 25.3% a year after his cut, against 9.1% a year for the Dow. He beat the index in eleven of those twelve years.
In all the years since, Buffett has never come close to those returns.
The reason isn't skill. It's size. In a 1999 interview, Buffett said he could make 50% a year on $1 million, and that not having a lot of money is a huge structural advantage. Greg Abel, who took over from Buffett as Berkshire's chief executive, wrote the same thing into the 2025 annual report:
At Berkshire's scale, the math of compounding works against us, a reality long understood and best acknowledged plainly.
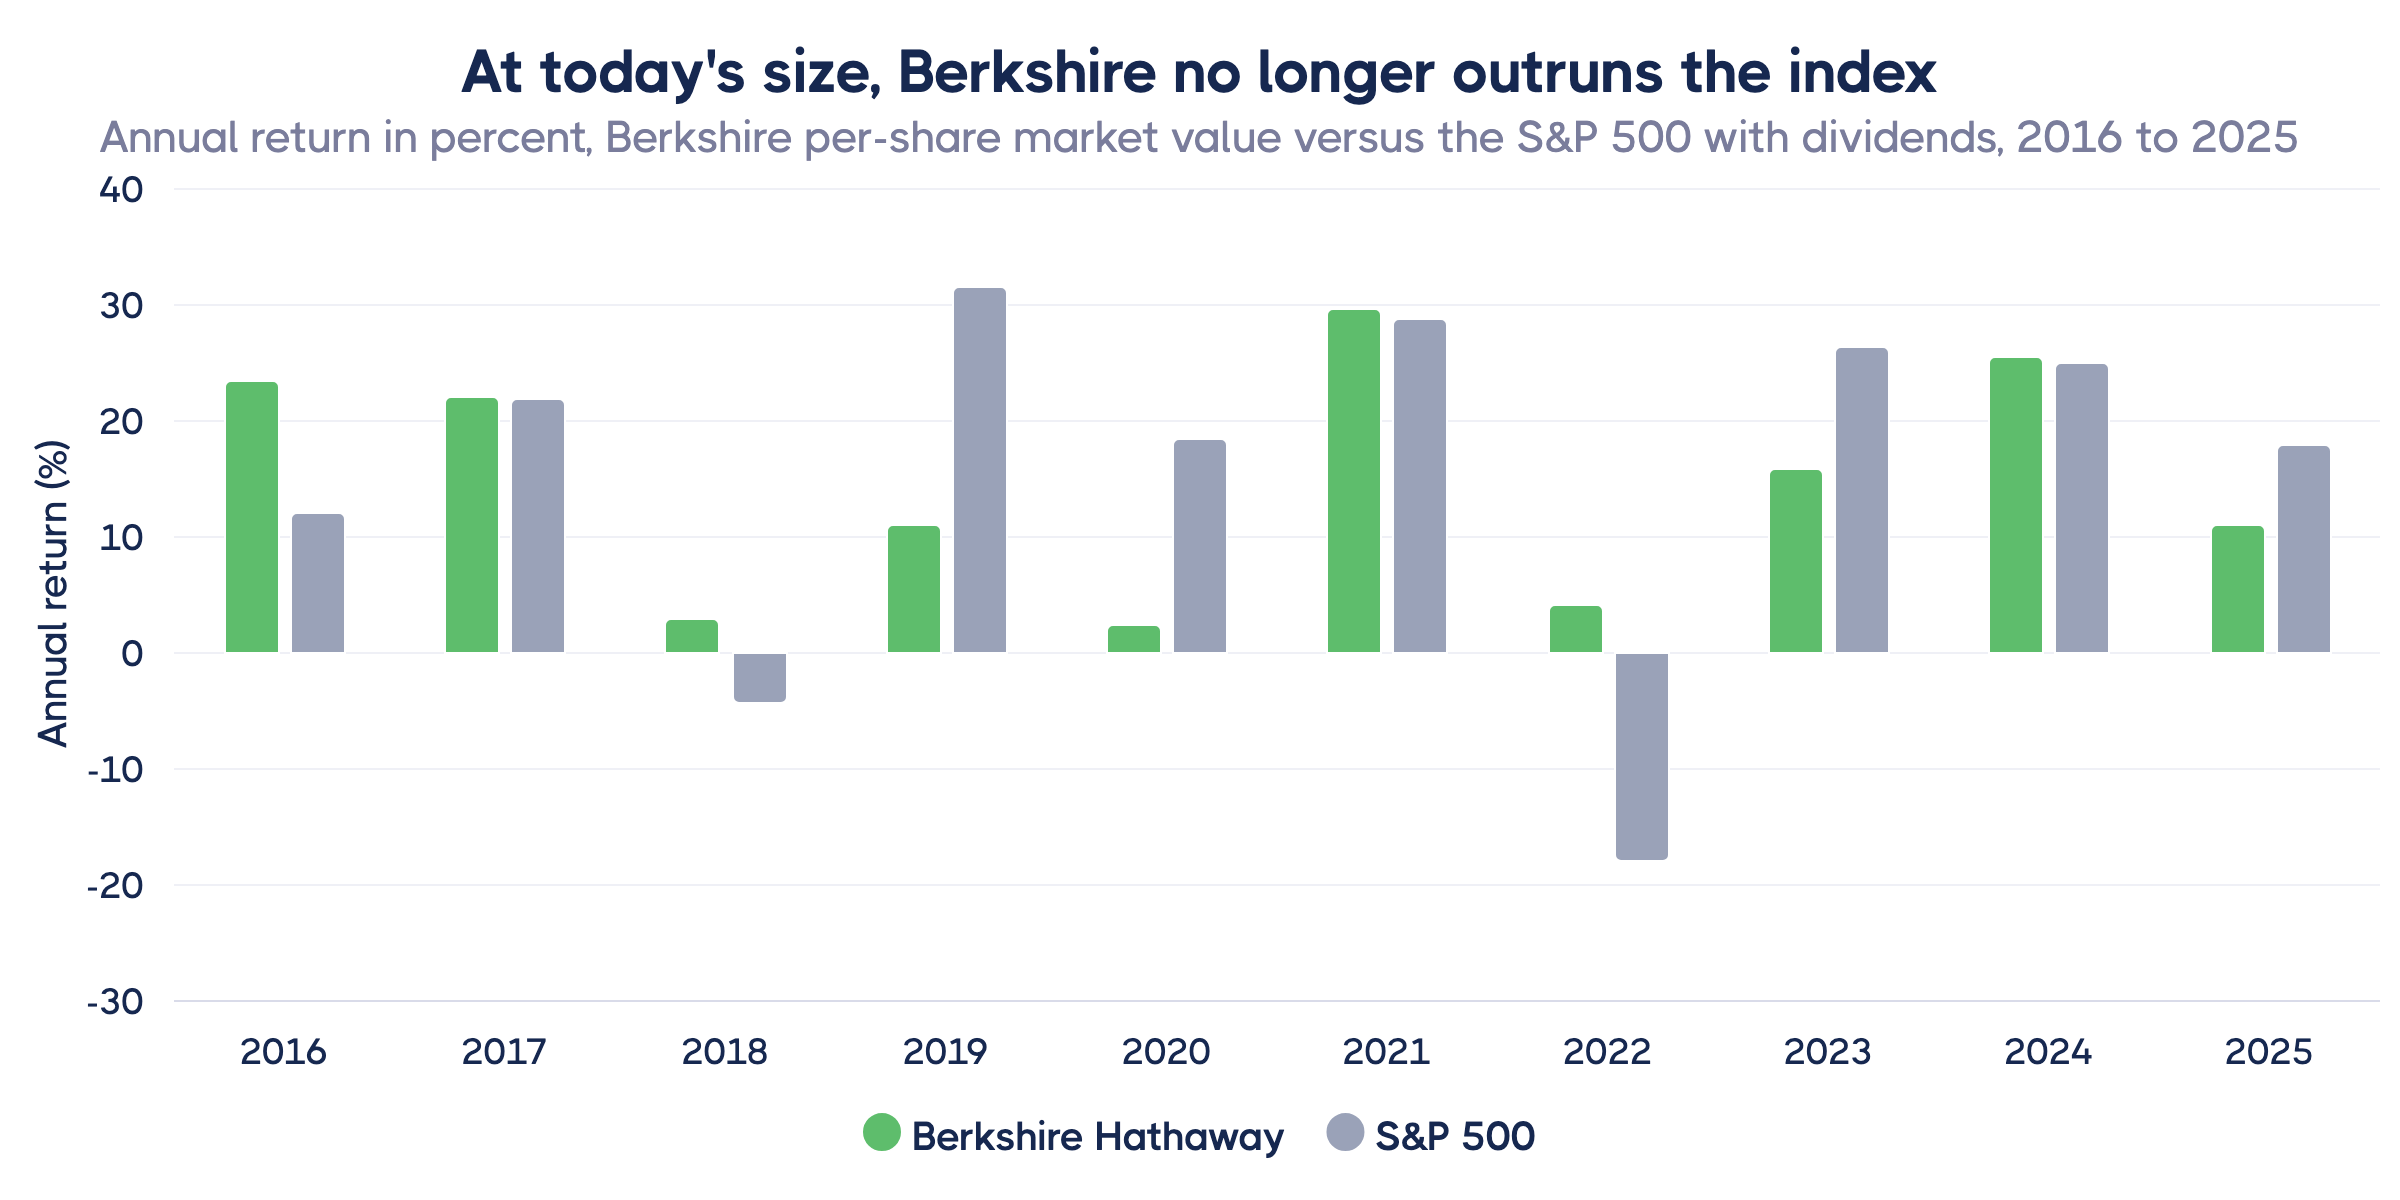
The numbers back him up. From 1965 to 2025, Berkshire compounded at 19.7% a year against the index's 10.5%. Over the last ten years, Berkshire returned 14.34% a year and the S&P 500 returned 14.82%. Same company. Same culture. Far more money to move.
The mechanic is simple. Big money can only be spent on big companies. That's why analysts cluster where the big money already is, and why thousands of smaller companies go years without anyone writing a word about them.
That leaves a measurable gap. The average large cap is followed by about seventeen analysts. Almost half of the Russell Micro Cap index, 44%, is followed by two or fewer (Essex Investment Management, Bloomberg data).
You don't have that size problem. A position that moves your returns might be a few thousand dollars, which puts the entire universe those funds skip within your reach.
But if nobody has written a report on a company, how do you judge it? You do the hard work yourself. That's the price of the edge, and it's the reason the edge still exists.
All you need is a repeatable way to read a business from its own numbers. So let's run one, start to finish, on a single company.
The company we picked for this analysis is AppLovin, ticker APP. It runs one of the leading advertising engines that decides which ad you see inside a mobile app, mobile games especially, and takes a cut of what the advertiser pays.
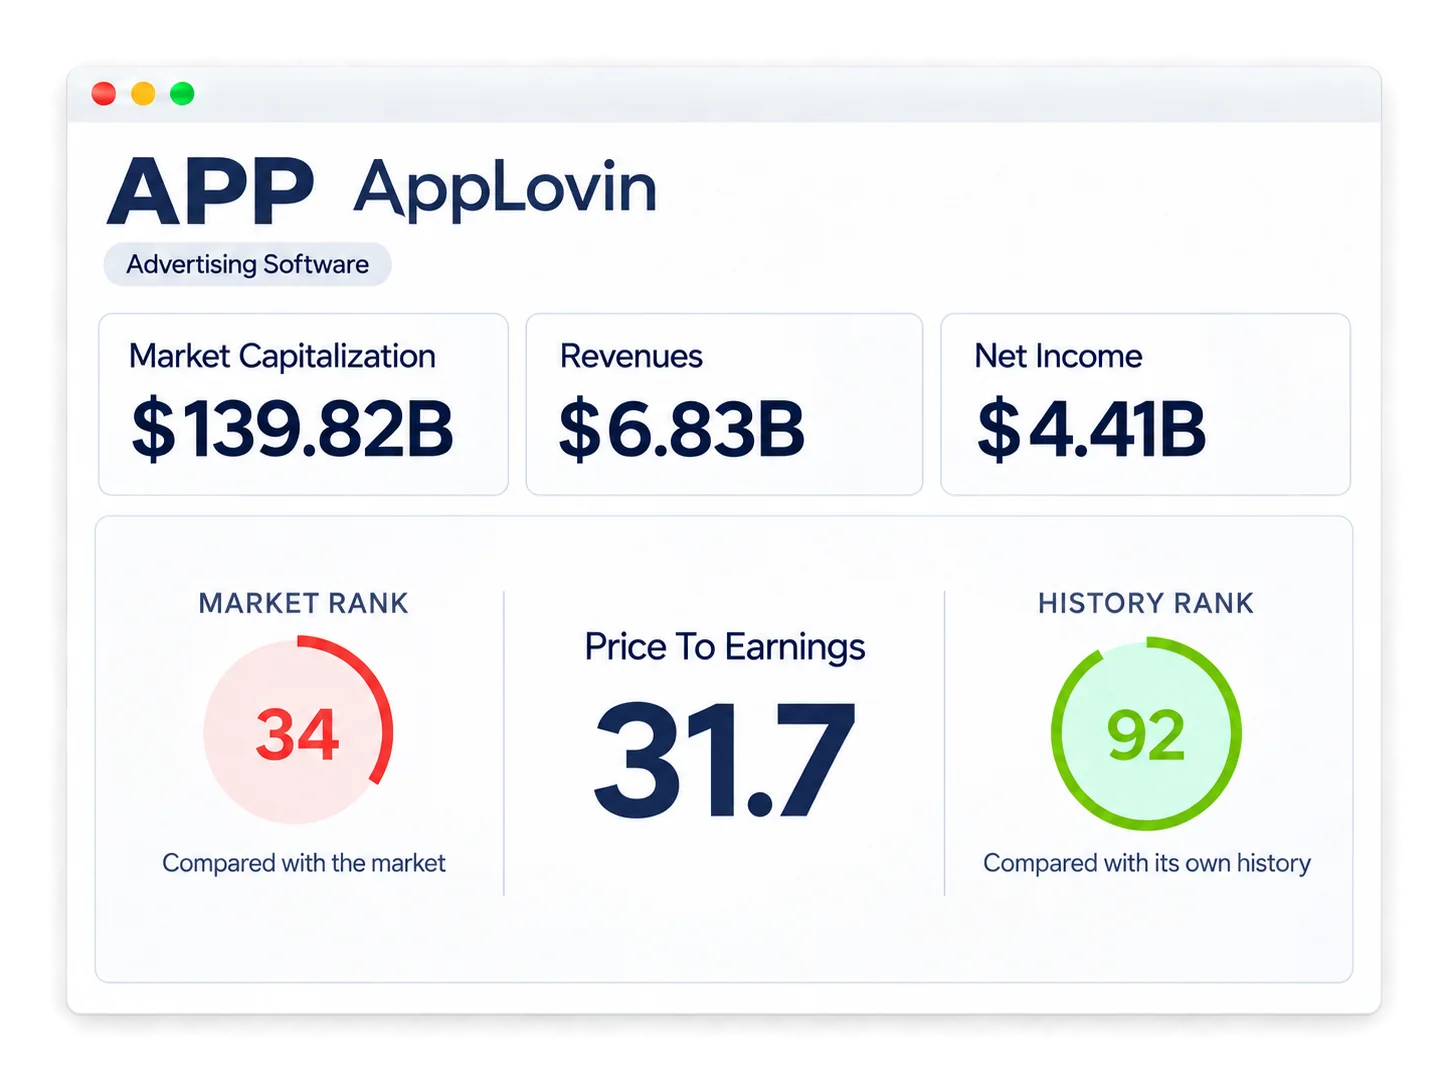
The first thing that jumps out is the price-to-earnings ratio. At 31.7 times earnings, AppLovin ranks 92 against its own history, which means the stock is cheaper than it has been at roughly nine out of every ten points over the past decade.
The real question, and the one this article sets out to answer, is whether that repricing is justified or whether the market has overreacted.
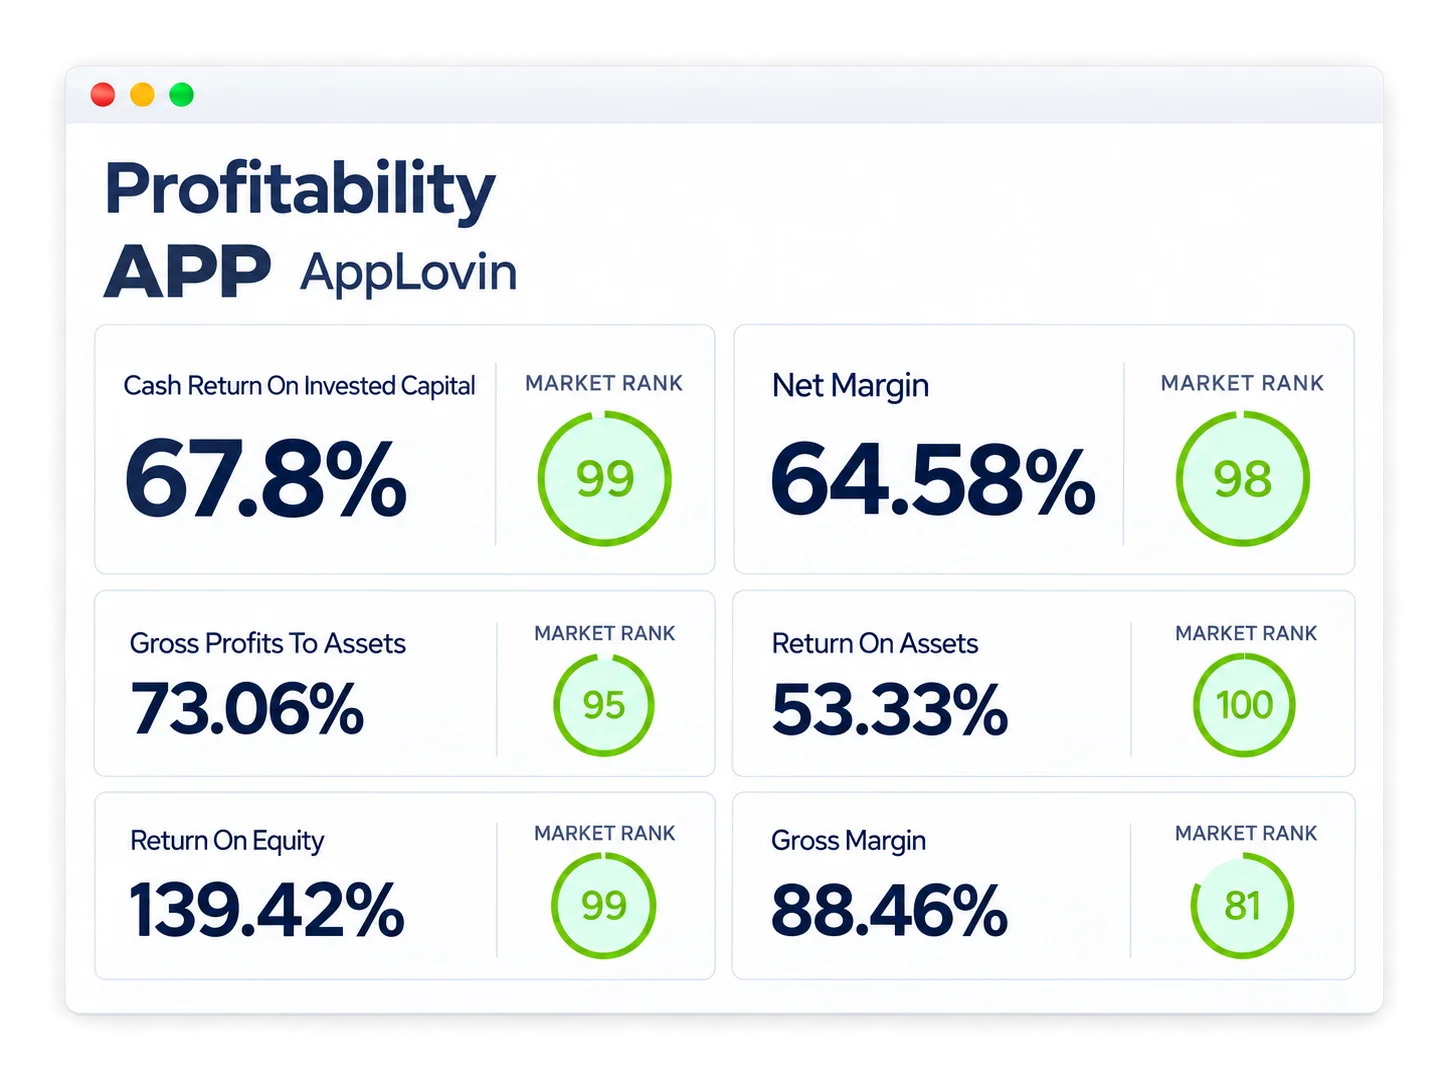
Turning to profitability, we see numbers that stand out from almost anything else in the market. Cash return on invested capital of 67.8%, next to an industry average of 27.43%. At a net margin of 64.58%, roughly 65 cents of every dollar of revenue ends up as profit. For comparison, The Trade Desk, the best-known independent company in the same industry, runs a net margin around 9%.
Where does a margin like that come from? It has to do with management keeping the company very lean. AppLovin generates roughly $7.6 million of revenue per employee. Very few businesses of any size come close to that.
The financial health check is quick. Free cash flow to debt of 0.89 means the company could clear 89% of its debt from a single year of free cash flow, and a current ratio of 4.3 means short-term bills are covered more than four times over. This business funds itself and has no need to raise outside money.
We already saw that AppLovin carries a StockIntent Score of 83. Attentive readers will have noticed that two rows in the rating panel, both covering the five-year sales history, are empty.
Those two blanks are dragging the score down. Both rows need five years of filings to calculate, and we don't hold five years of filings for AppLovin yet.
On the shorter sales history, which we look at next, the numbers are very strong. The missing filings are a matter of time, not a matter of substance, so we expect another bump in the StockIntent score soon.
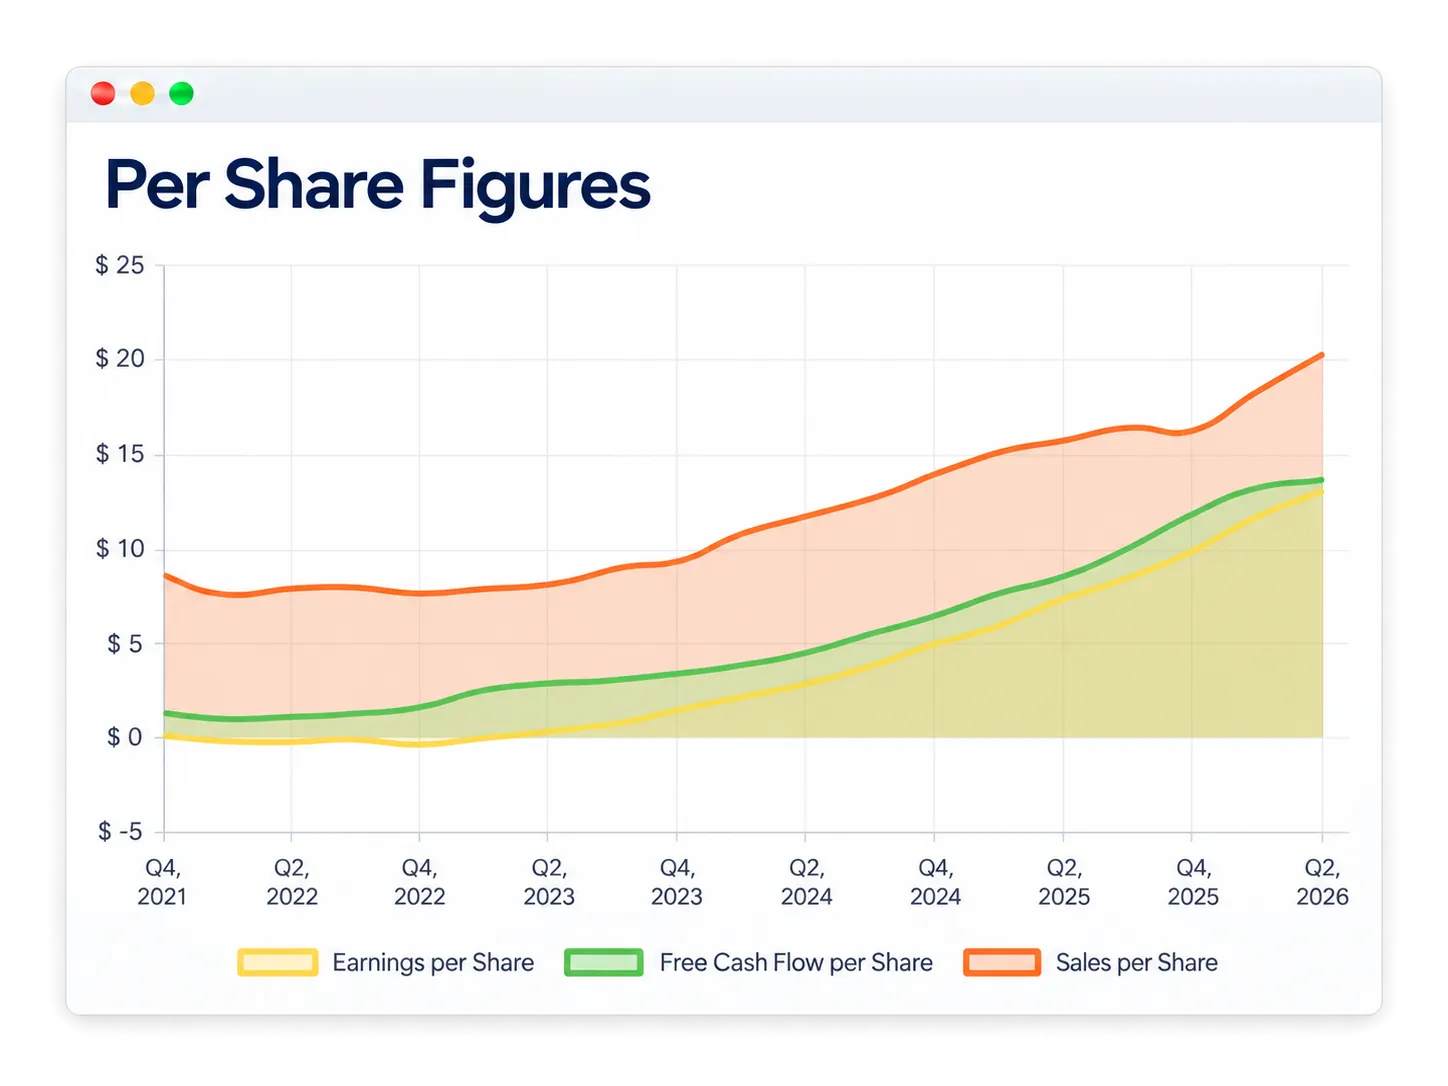
Revenue first, because it closes the loop on those two blank rows. AppLovin's revenue ran about $2.9B in 2022 and sits near $6.83B on a trailing basis today, with the steepest part in the last two years. Sales per share went from roughly $8.50 to roughly $20. The five-year metric might be missing, but the trend definitely isn't.
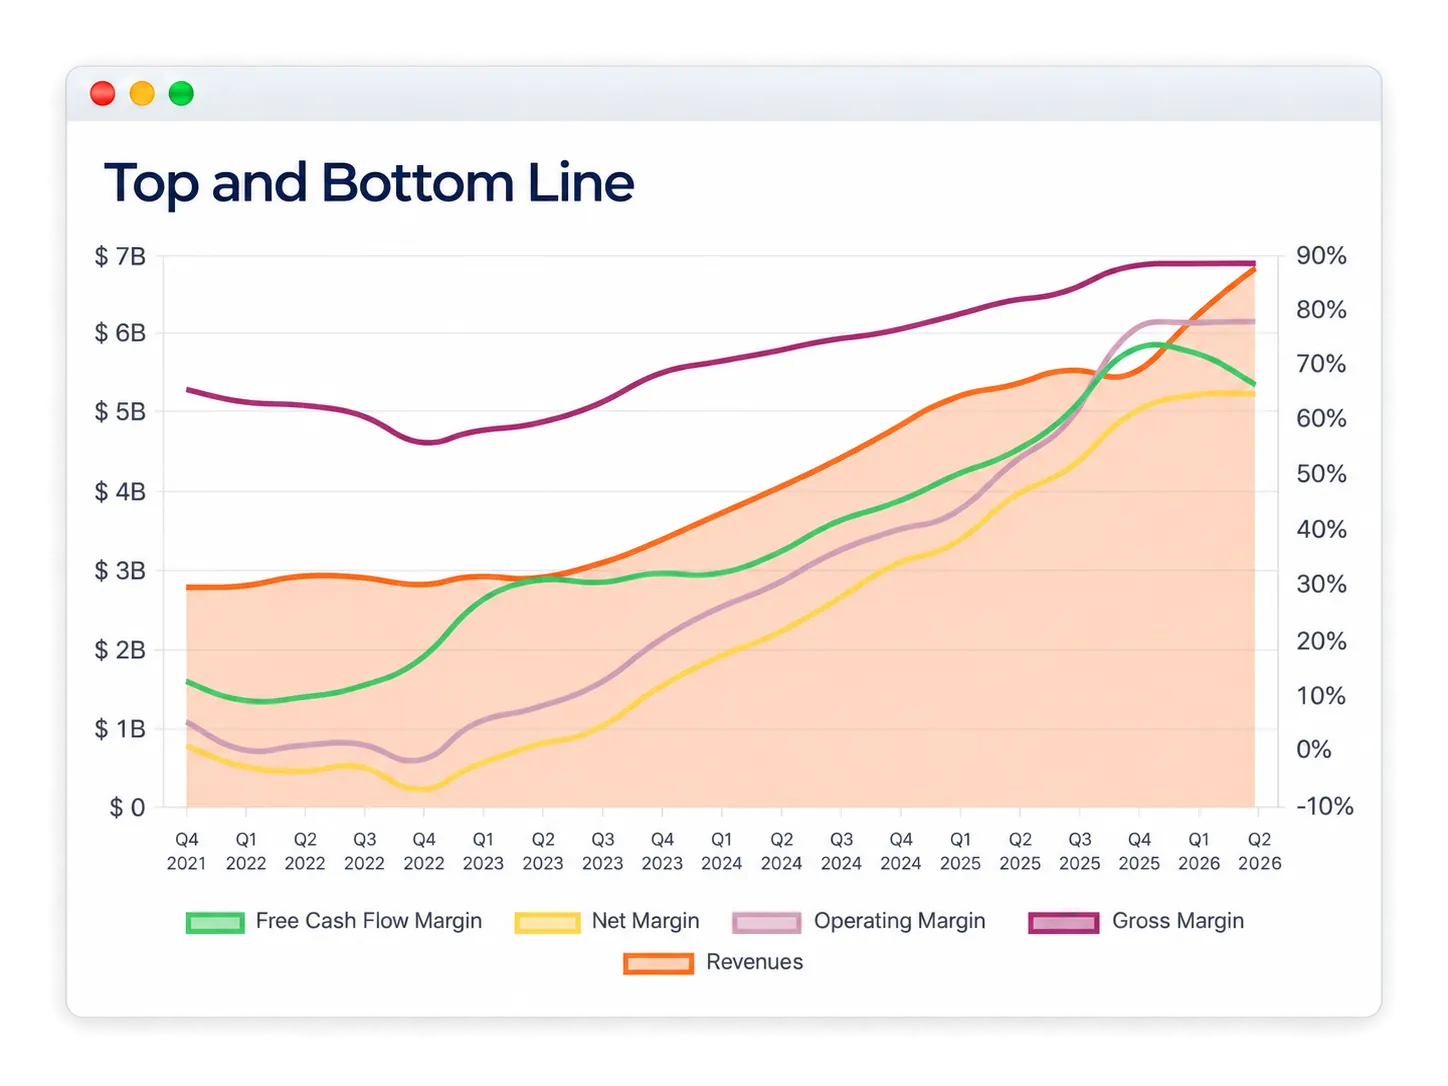
The margin lines matter more than any single number on this page. Operating margin climbed toward nearly 80%, while net margin reached the mid-to-high 60s. All of it while revenue accelerated.
Margins expanding and revenue accelerating at the same time is rare. It's what separates real operating leverage from a growth story.
Three factors drove this expansion. First, amortization from earlier acquisitions rolled off, including MoPub, which AppLovin bought from Twitter for $1.05 billion. Second, AXON 2, a materially better version of the company's matching model, lifted margins from its release onward. Third, in June 2025 AppLovin sold 10 mobile gaming studios to Tripledot for $400M in cash plus about 20% of Tripledot's equity. That sale removed a lower-margin, capital-hungry segment and left a pure advertising platform behind.
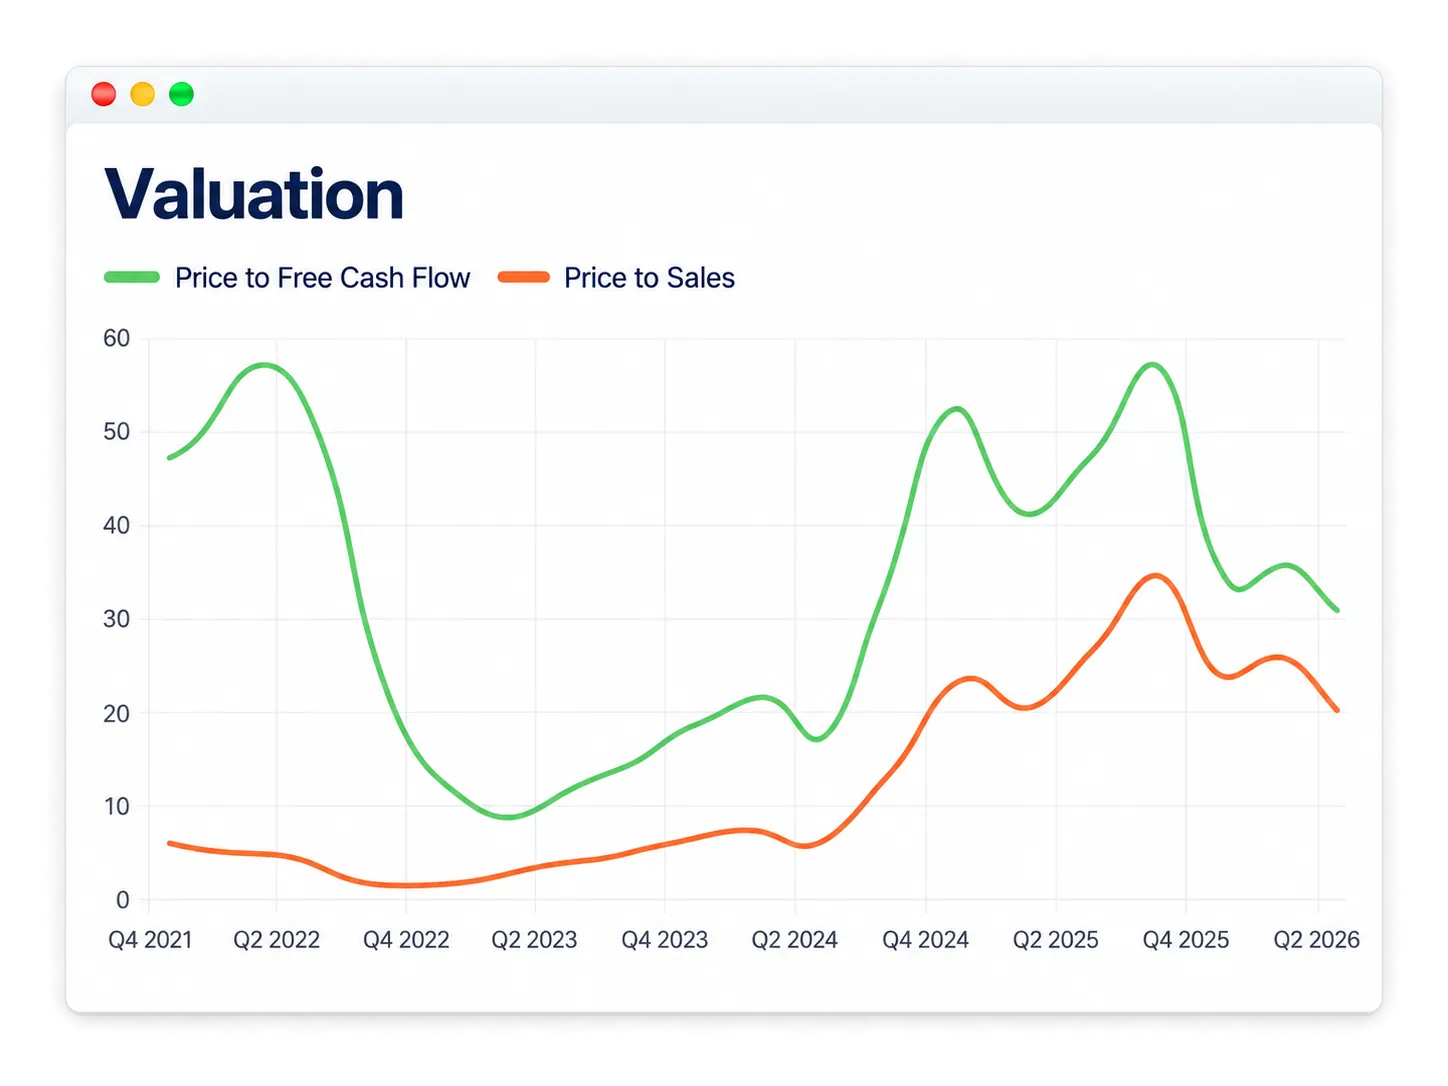
Meanwhile the valuation multiples went the other way. Price to sales peaked around 34 in late 2025 and sits near 21 today. Price to free cash flow peaked around 57 and sits near 31. Both compressed from their 2025 peaks while the fundamentals kept improving.
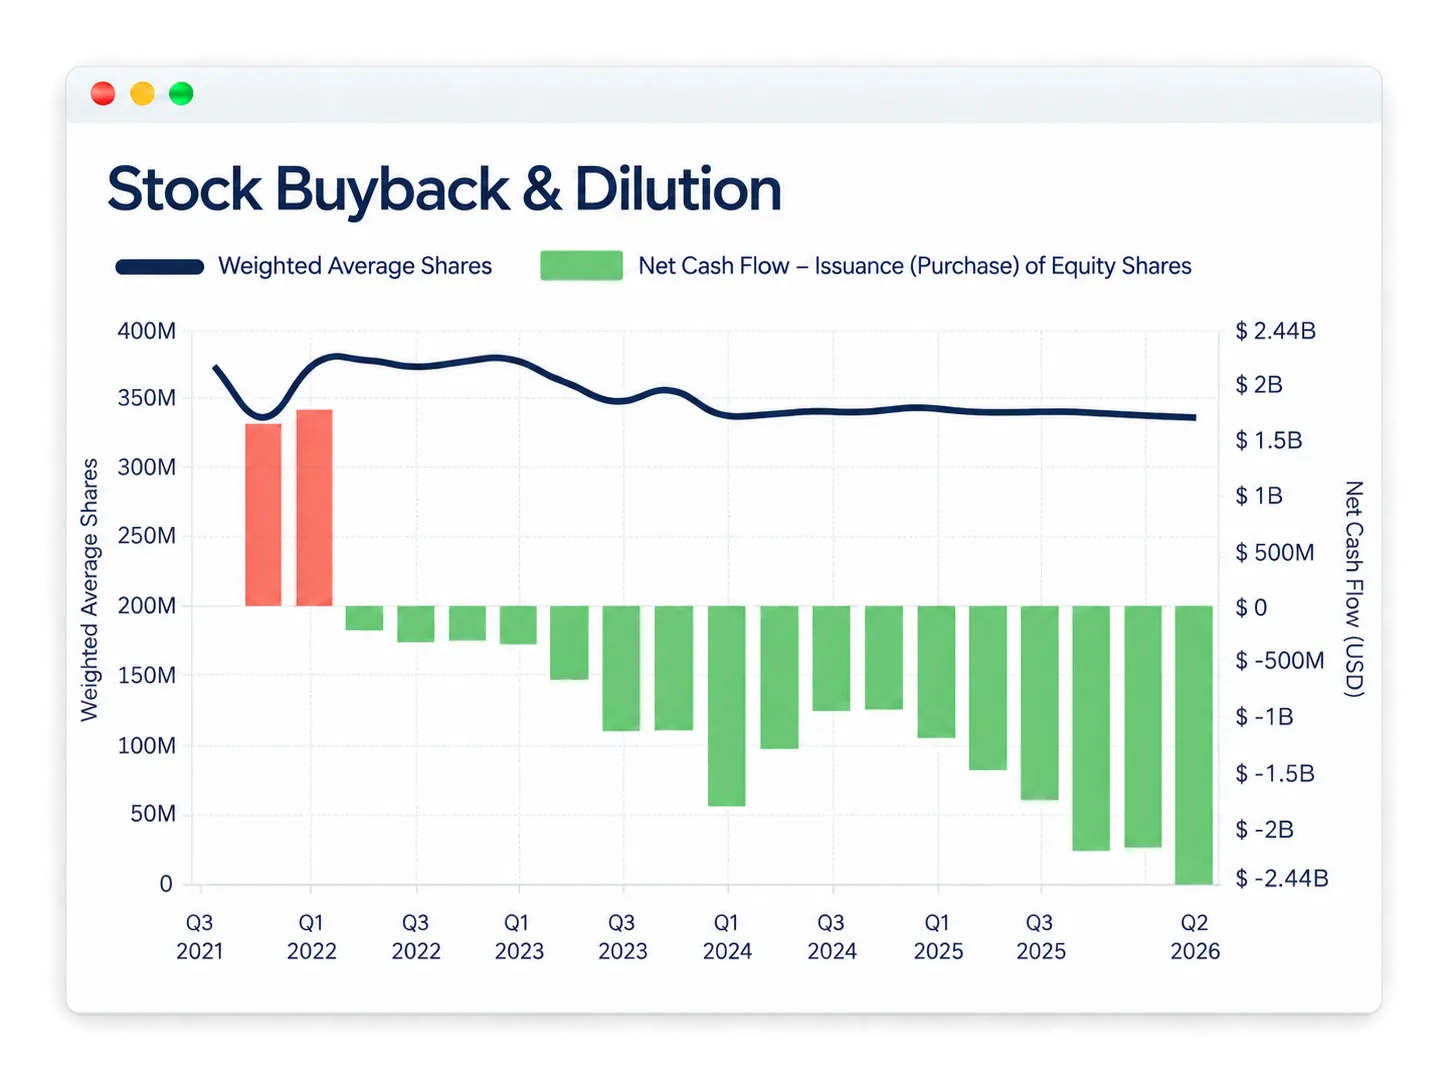
Management's recent capital allocation is a good sign. As the share price fell through 2025, they leaned into buying back more shares. In the second quarter of 2026 alone they spent $551.3M on repurchases. Weighted average shares are down from about 370M to about 335M.
Management is telling you, with their own money, that it thinks the stock is undervalued. Buybacks only create value below intrinsic value, and this management team is buying now rather than at the top.
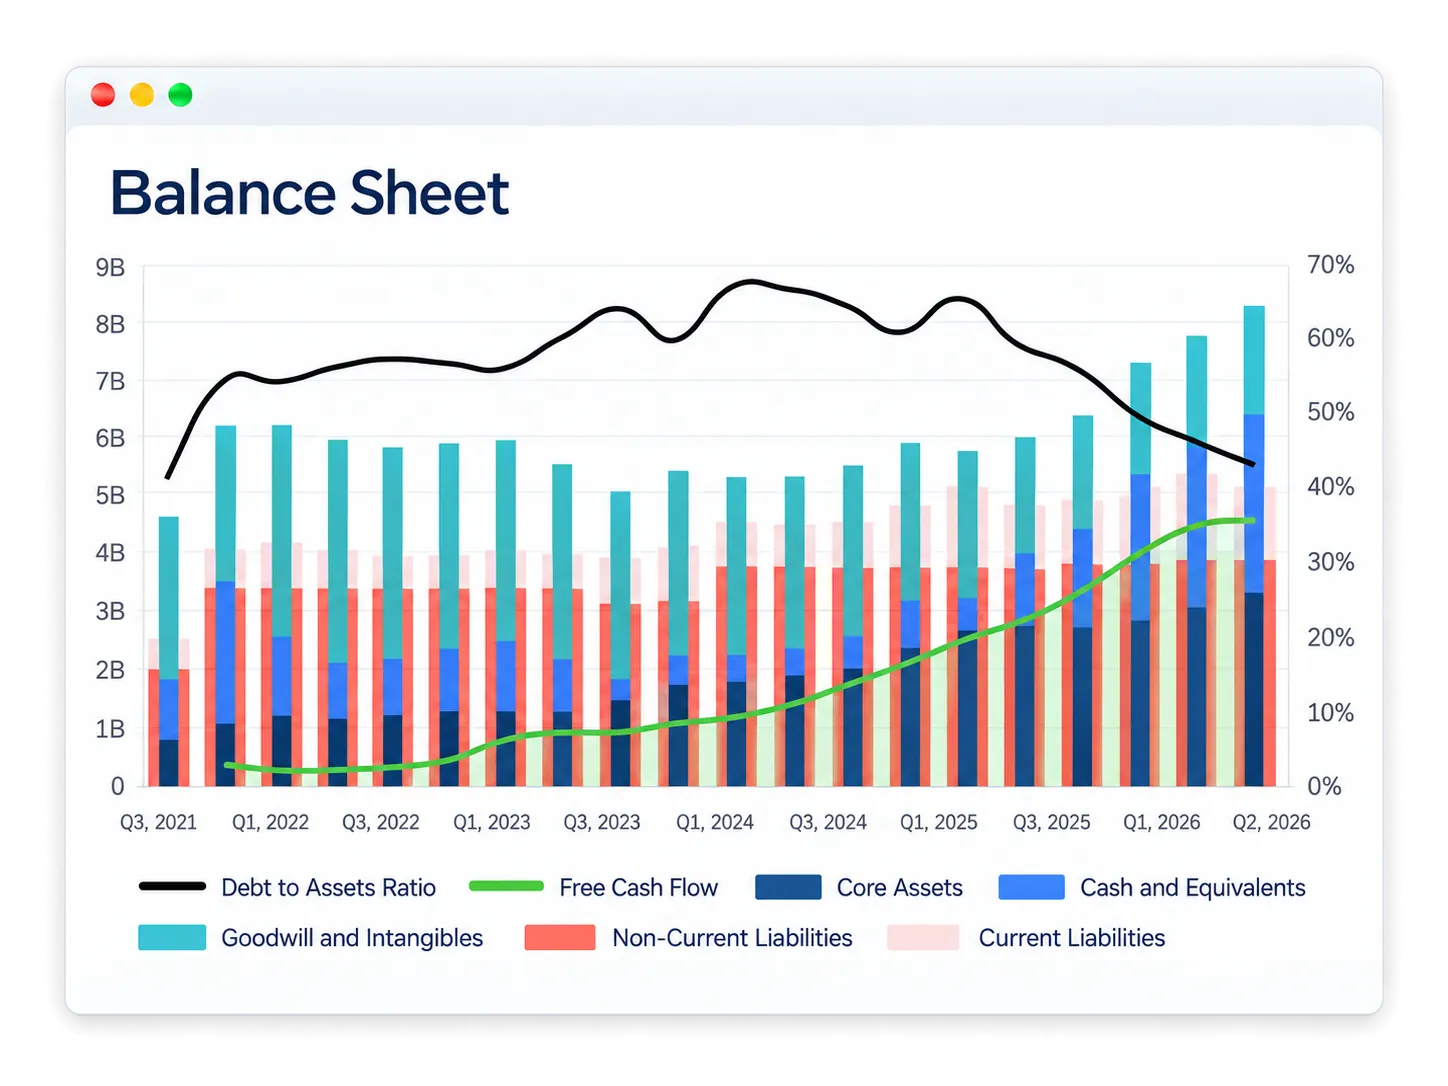
The balance sheet makes that spending look even better. Over the same stretch that management was returning cash to shareholders, debt to assets came down from about 62% to about 42%. Free cash flow climbed from near zero to roughly $4.5B, and assets grew with it.
Paying down debt and buying back stock usually compete for the same dollar. Here the business generates enough to do both and still build cash.
So far we've seen a lot of promising numbers. Let's look at the business model underneath.
AppLovin sits on both sides of the ad marketplace. MAX runs the auction for app publishers who have ad space to sell. AXON spends the budget for advertisers who want to buy it. The company keeps the gap between what an advertiser is ready to pay for an outcome and what it costs to win the impression.
The better the model predicts, the wider that gap. And almost none of that extra dollar carries an extra cost. Growth and margin expansion come from the same place which explains why both are happening simultaneously.
How wide is the gap? AppLovin books revenue as an agent, net of what it pays publishers, so the revenue you see already is the cut. The take rate itself can't be observed from outside. Public estimates run anywhere from 30% to 50% of every advertiser dollar (GameMakers), but nobody outside the company leadership knows exactly.
Either end of that range is remarkable. The Trade Desk, the best-known independent buyer in the industry, discloses a platform fee near 15-20% of the spend it places (AdExchanger). It stands on one side only and never owns the marketplace, so it never controls both ends of the trade.
AppLovin does. That structural difference is why one business runs a 9% net margin and the other runs 65%.
Today the position is deeply entrenched. MAX reaches up to 1.4 billion daily active users across more than 140,000 apps, and mediation research puts it at roughly 55% of top-grossing mobile games, against about 25% for Unity's LevelPlay and 13% for Google's AdMob (GameBiz).
The monetization gain is the part that matters. When Tripledot moved its solitaire portfolio onto MAX, average revenue per daily active user rose about 20% in A/B testing. That's the kind of result a publisher doesn't walk away from.
But the spread only holds while the model keeps predicting better than everyone else's. Both Meta and Google are working to close that gap, and either one can outspend AppLovin many times over. AppLovin has defended the lead so far. It has to keep defending it.
We go through all of this in detail in our AppLovin moat analysis.
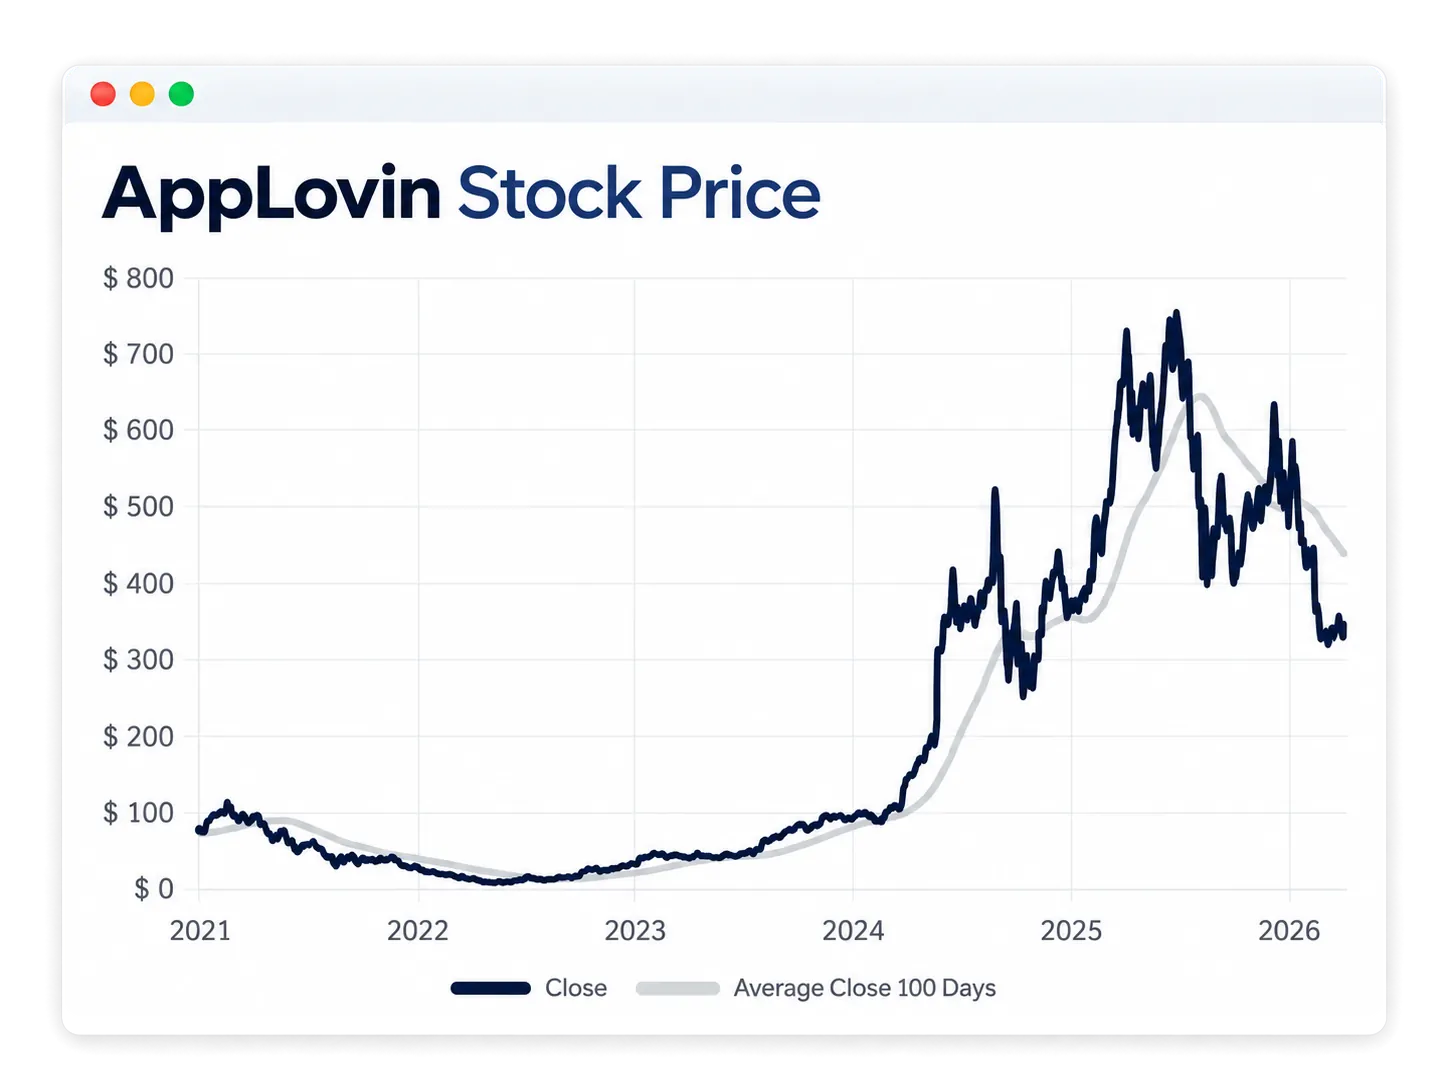
In Q2 2026, AppLovin grew revenue 53% to $1,924M. Adjusted EBITDA margin was 84%. Net income from continuing operations rose 64%.
Revenue came in $16.3M below the roughly $1.94B analysts expected. That's a 0.8% shortfall.
The stock fell as much as 28.7% after hours, and roughly $40 billion of market value came off at the session low.
The bears have a fair point here, and it isn't the miss. Management also guided Q3 growth a couple of points slower, and guided margins down with it.
Fair enough. But price in the softer guidance and you still have a company growing 46-48% at an 83% EBITDA margin. That business shed $40 billion over a rounding error and a small trim to the outlook. The reaction looks radical rather than rational.
Whether the stock is actually cheap is a different question. That one needs a proper valuation.
We think AppLovin is benefiting directly from an industry-wide trend. WPP Media, one of the largest media buyers in the world, puts global content-driven advertising revenue at $720.2B for 2026. Budgets keep moving toward channels where a buyer can measure exactly what the invested money did.
That is exactly the kind of advertising where AppLovin's edge sits.
We also looked at what Wall Street expects from here. Analysts model revenue of $8.1B in 2026, $10.3B in 2027 and $12.6B in 2028, which works out to about 25% growth a year. They model free cash flow rising from $5.2B to $8.6B over the same window, with free cash flow margin widening from about 64% to about 68%.
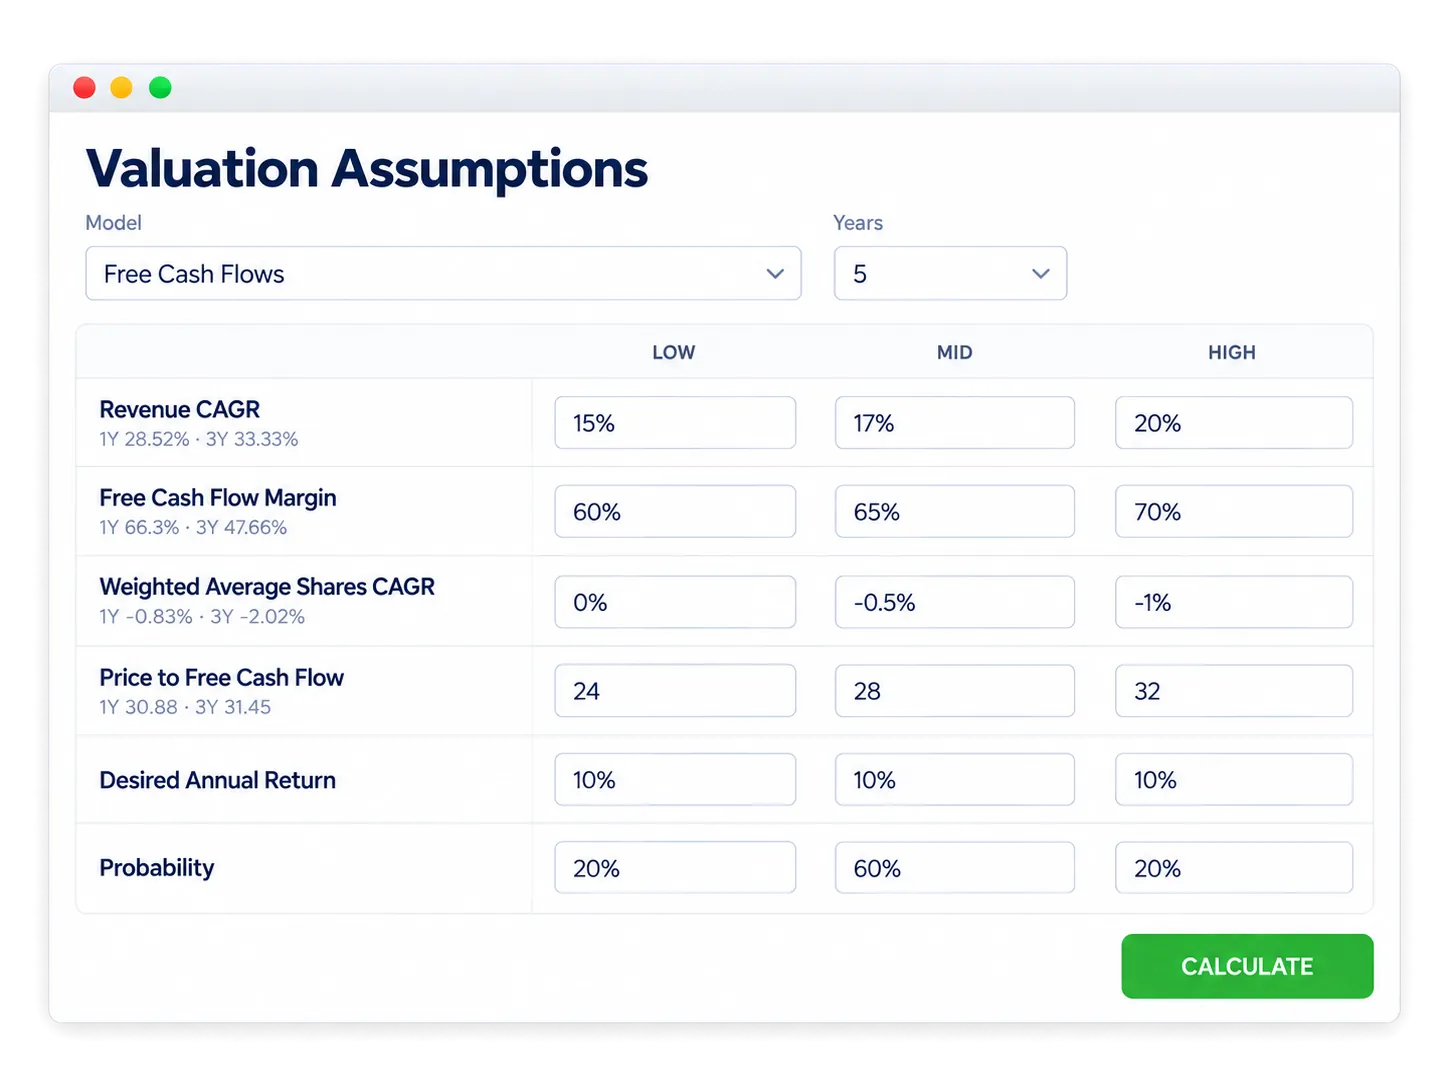
Every single model input sits below what management achieved historically, or below the estimates of current analysts.
The high case assumes 20% revenue growth against a 28.52% one-year actual and consensus of about 25% a year through 2028. The mid case assumes a 65% free cash flow margin against 66.3% today, with analysts expecting that to widen toward 68%.
We chose those inputs deliberately. They leave extra margin of safety, enough room to absorb another round of guidance cuts before the numbers stop working.
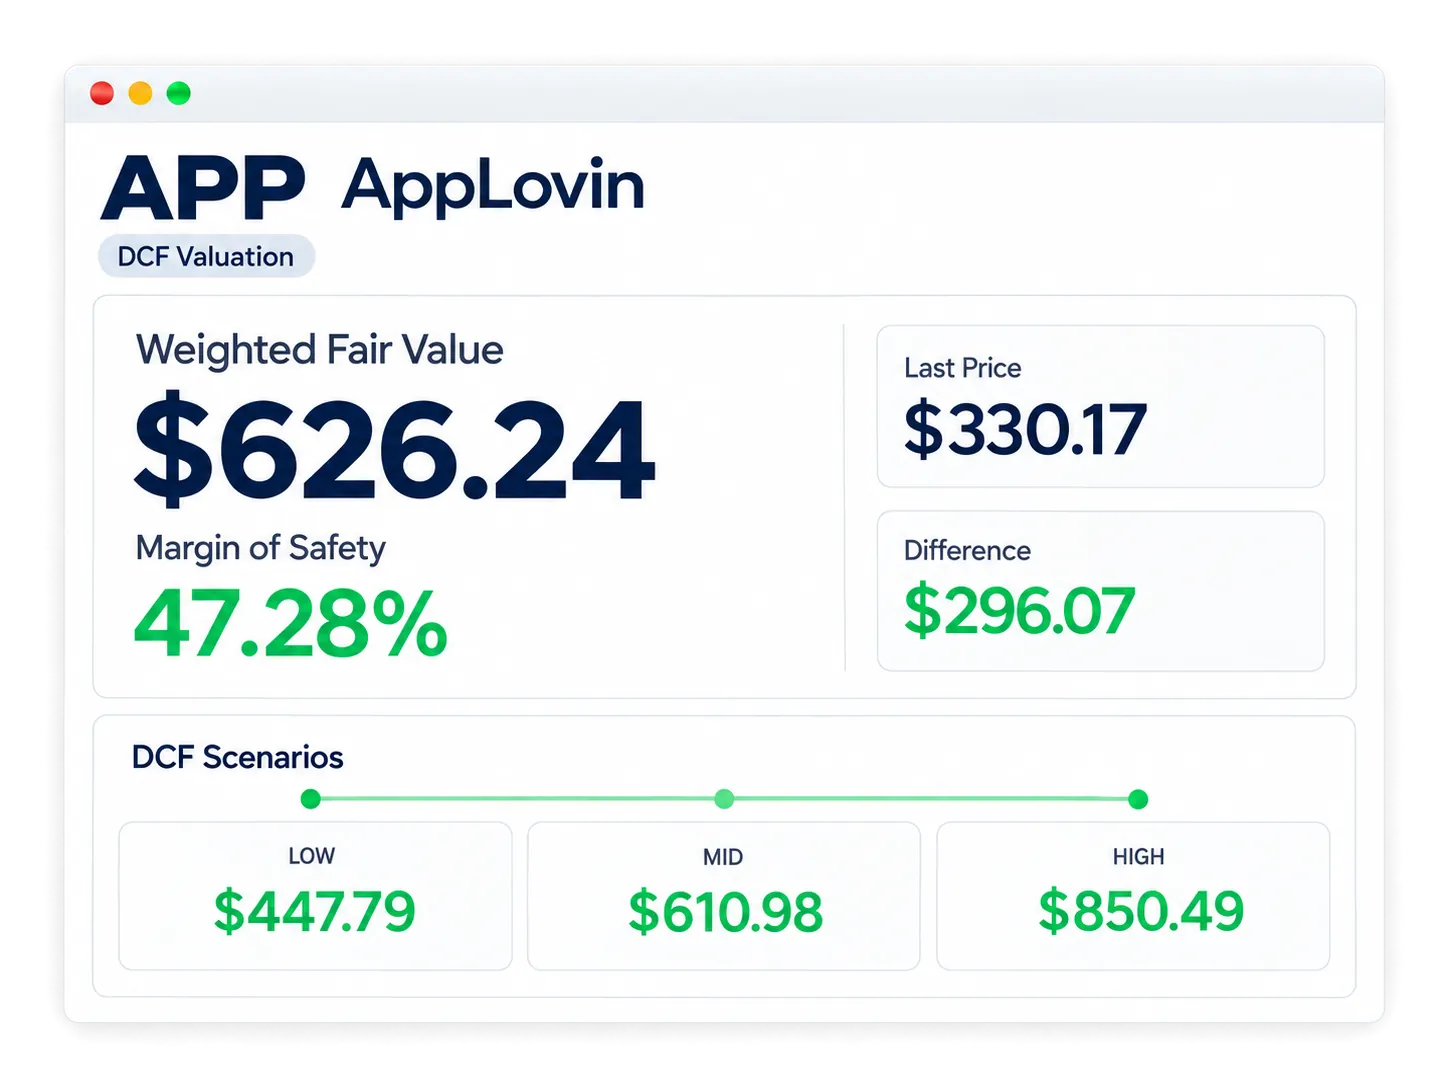
With those assumptions baked in, fair value comes to $626.24. Against the $330.17 closing price on September 21, 2026, that's a margin of safety of roughly 47.28%.
Even the low case, which is very pessimistic next to what analysts expect, puts fair value about 36% above that closing price.
The gap between $330.17 and $626.24 is about 90%. So yes, closing that gap is roughly a double.
Three things have to be true for it. Revenue has to compound at 15-20% a year for five years. Free cash flow margins have to hold somewhere near 60-70%. And at the end of it, the market has to still pay 24 to 32 times free cash flow for this wonderful business.
We're not alone in that neighborhood, either. Kyle Grieve and Shawn O'Malley of The Intrinsic Value Podcast built their own model on this company with deliberately pessimistic inputs, assuming growth below what management currently guides to, and margins fading. Once their personal 30% margin of safety is accounted for, their model implies a fair value near $686.
You just read our process run on one company, from the eight metrics behind the score, through the charts, to a valuation with every data point visible and transparent.
StockIntent runs that same process on every listed company, including the micro caps with the potential to give you a real edge.
Micro caps are where it gets interesting. AppLovin already has 33 analysts covering it. Run the same eight metrics, the same charts and the same valuation on small and micro caps, and you're somewhere else entirely. Roughly one in five has no analyst writing about it at all, and close to half are covered by two or fewer.
Nobody has done the work. There is no report to read. The only way you'd ever find them is to run the numbers yourself, which is exactly what StockIntent is for.
That's the pond Buffett fished before the money got too big. Tiny, obscure, overlooked companies no institution would touch.
His limited partners compounded at 25.3% a year in it.
That pond still pays. We backtested our own micro cap screen, and the annual return comes in right in line with what Buffett earned in his partnership years.
StockIntent costs less per day than a cup of coffee, which is nothing against the value of one better decision. There's a free trial, so you can run it on a company you already own before you decide anything.
Start your 7-day free trial and find quality compounders faster.
— StockIntent Score ╌ S&P 500