Oct 18, 2026
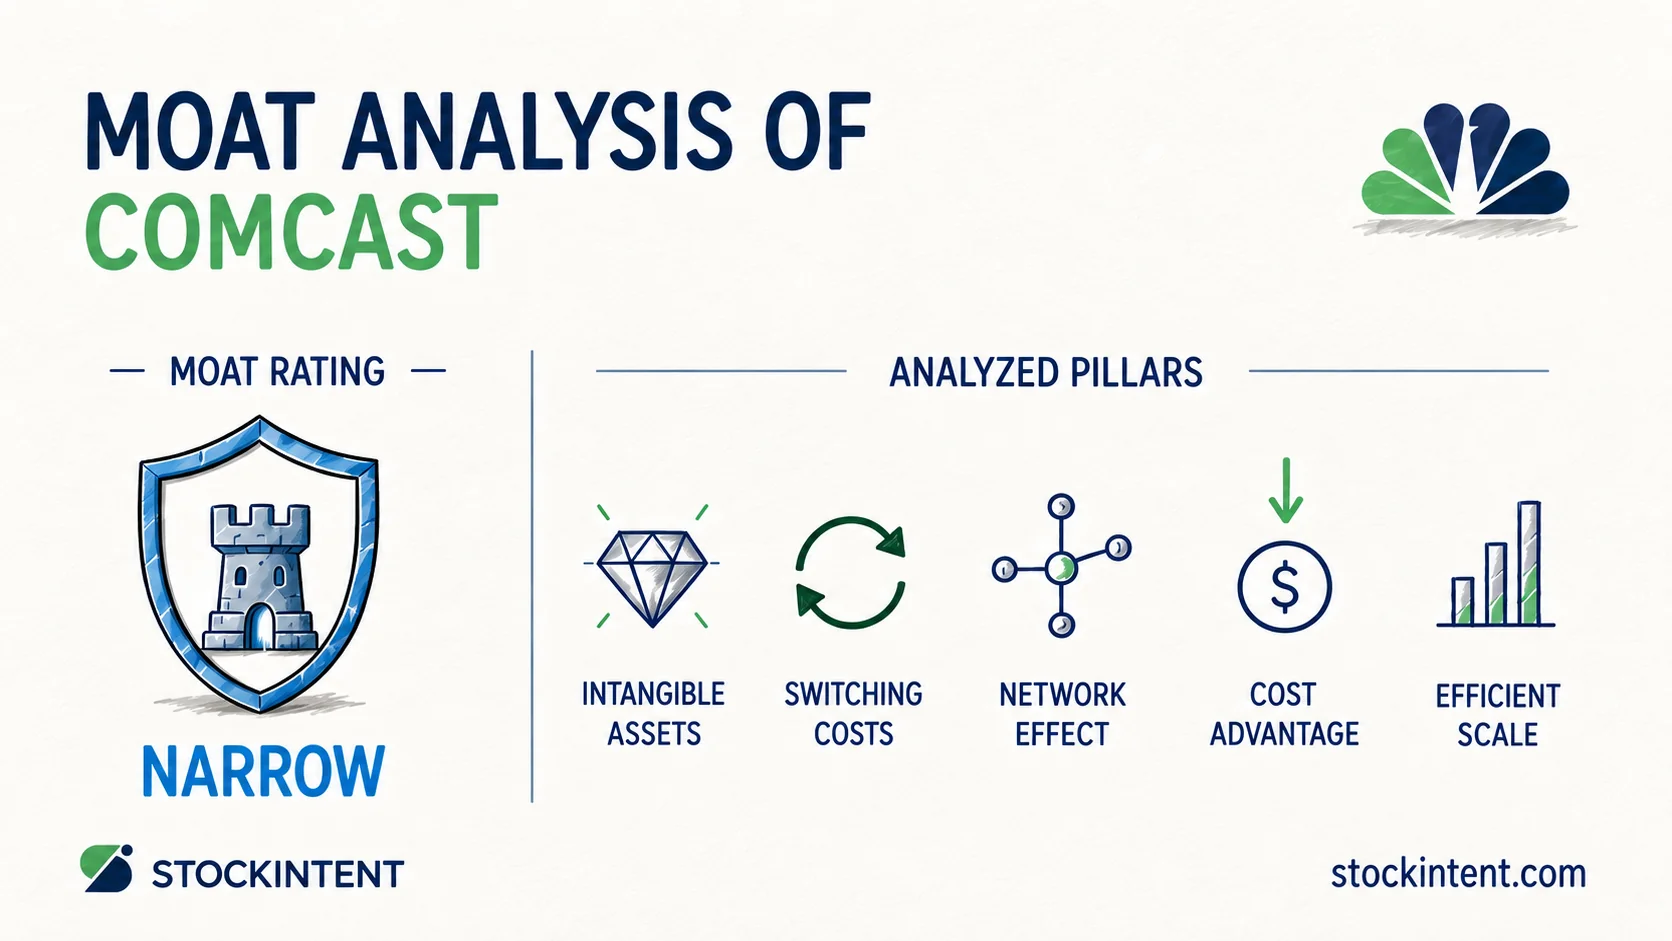
We assign Comcast a Narrow economic moat rating, with a Weakening trend and Medium uncertainty. Its competitive position rests on customer switching costs, a structural cost advantage, and partial efficient scale in local broadband markets.
Recent financial results show the pressure on this franchise. In Q2 2026, Comcast domestic broadband ARPU fell 3.8% year over year. The company also lost 167,000 broadband customers in the same quarter. Shrinking subscriber numbers combined with falling pricing are clear signs of an economic moat under strain.
Here are our main takeaways:
Moat ratings help investors evaluate how long a company can protect returns on invested capital. In this analysis, we assess each competitive pillar, review 2026 performance, and outline the metrics that would alter our view.
Comcast in 2026 relies primarily on switching costs and cost advantages. Efficient scale supports specific local cable territories, while intangible assets generate value outside broadband. True network effects do not exist here in any material way.
Switching home internet providers creates real friction. Customers have to return hardware, schedule service windows, and set up home networks again. Comcast increases that friction by bundling wireless plans with home internet, making provider changes more disruptive. Commercial clients show similar retention patterns. In our view, switching costs provide Comcast most durable economic defense today.
Comcast spent billions building its hybrid fiber-coaxial physical network over several decades. Operational scale in routing, customer support, and equipment procurement yields lower unit costs than regional competitors face. DOCSIS standard upgrades also let the firm boost capacity across existing lines without stringing new fiber to every individual premise, as noted by Clearthesis. Challengers must fund complete local line builds to match that coverage.
Many municipal markets support only one or two fixed-line providers, which historically discouraged overbuilding. That dynamic is losing strength. Fiber operators continue expanding their lines, and 5G fixed wireless works around physical wireline limits entirely. We rate efficient scale as Moderate because market dynamics are working against it, even though local infrastructure advantages remain intact.
Universal studio IP, NBCUniversal, Telemundo, Peacock, and the theme parks provide media assets that traditional broadband rivals lack. These properties support direct audience monetization, as detailed by Nightclaude research. These media assets protect entertainment revenues rather than internet distribution, so they do not shield the core broadband business from fiber competition.
We find little evidence of self-reinforcing network dynamics across Comcast operations. New broadband signups do not enhance service value for existing customers. Peacock subscriber expansion also generates very modest platform benefits. Evaluating Comcast through a network-effects lens does not reflect its economic model.
In short, two core pillars support the moat, one is eroding, one is peripheral, and one does not apply. The key test is how these factors influence current operating results.
Comcast 2026 results mirror this split moat profile: network quality and customer retention remain solid, while pricing power continues to slip.
Independent testing confirms the network remains competitive. In Opensignal's 2026 fixed-broadband study, Xfinity captured the top download speed ranking and scored well on overall consistency. Charter led on connection reliability, but Comcast outscored both AT&T and Verizon across fixed-line consumer metrics.
Customer retention metrics showed some stabilization early in the year. In Q1 2026, domestic broadband customer losses improved by 117,000 year over year to 65,000. Traditional pay-TV cancellations, however, continued at an elevated pace.
Service bundles are sustaining customer relationships. Comcast added 435,000 wireless lines in Q1 and 448,000 lines in Q2. Households that use Comcast for both broadband and wireless churn at lower rates, reinforcing switching costs.
From our experience: Investors often link strong moats directly to pricing power. Comcast 2026 results show high network quality paired with declining ARPU and customer losses. A moat that wins technical performance tests without holding unit pricing behaves defensively, which directly limits future returns.
Broadband ARPU dropped 3.1% year over year in Q1, with declines accelerating into the second quarter. Converged average revenue per account also fell 1.5%. Management confirmed at Goldman Sachs' Communacopia event in September 2026 that free wireless promotions inside bundles are diluting broadband ARPU.
Comcast is keeping bundled subscribers by conceding ground on plan pricing. That trade-off informs our current moat trend assessment.
We rate the moat trend as Weakening based on nationwide market-share losses. Cable share of U.S. broadband dropped from over 65% five years ago to roughly 51.2% in 2026. Fiber now controls about 32.4% of the market, and 5G fixed wireless has reached approximately 14.1%, according to TelecomLead's 2026 ISP analysis.
Budget-conscious consumers now have access to gigabit fiber plans priced between $30 and $40 per month. Comcast has responded by rolling out simplified, lower-cost standard plans instead of testing premium price points, as reported by Trefis.
Comcast broad operating base prevents this competitive shift from becoming catastrophic. It remains the largest U.S. broadband operator with 31.3 million accounts and roughly 23.9% national market share. The wireless cross-sell is expanding, with management posting 448,000 wireless additions in Q2 2026. The business moat is deteriorating, but the core franchise remains massive.
Our watchlist for the next three to five years:
Investors can follow these metrics directly in corporate filings or with portfolio tracking tools. Using a StockIntent watchlist helps you track revenue growth, operating margins, and cash generation over time. These operational variables determine our overall uncertainty rating.
We assign Comcast an uncertainty rating of Medium. This rating indicates a moderately wide dispersion of potential future cash flows rather than an unmanageable financial risk profile.
Revenue diversification limits operational volatility. Comcast generates cash flow across broadband, mobile, studio entertainment, streaming, and theme parks. Peacock reached its first profitable quarter in 2026, reducing losses from streaming. On the Q2 2026 earnings call, management warned that it expects fixed-line internet competition to intensify further.
Falling margins illustrate the financial cost of this competition. Trailing twelve-month operating margins slipped to 14.7% compared with 18.1% a year ago, touching a five-year low according to Yahoo Finance and Trefis. Comcast balance sheet shows no acute distress, but ongoing network upgrades and aggressive promotions continue to compress margins.
Future cash flow variability will depend on these dynamics. If mobile bundling protects internet revenue, returns will stabilize near current levels. If alternative fixed wireless services and accelerated fiber deployments take more market share, Comcast returns will contract further.
Comcast retains a Narrow economic moat, alongside a Weakening trend and Medium uncertainty.
The 2026 operating data supports this view. Network performance is solid, wireless bundling keeps customer churn manageable, and the firm retains scale. Broadband subscriber losses and falling ARPU demonstrate that unit economics remain under sustained pressure.
The central issue ahead is whether bundled mobile plans can offset ongoing broadband market-share losses. Regaining pricing power without accelerating subscriber cancellations represents a significant operational hurdle.
Two trends would prompt a rating revision. Broadband ARPU stabilization would suggest switching costs have stabilized the business. Conversely, faster fiber overbuilding in core service regions would prompt us to downgrade our moat assessment.
Investors should monitor broadband customer numbers and capital spending priorities closely as new quarterly reports emerge.
This analysis is for informational and educational purposes only and does not constitute investment advice.
Start your 7-day free trial and find quality compounders faster.
— StockIntent Score ╌ S&P 500