Oct 13, 2026
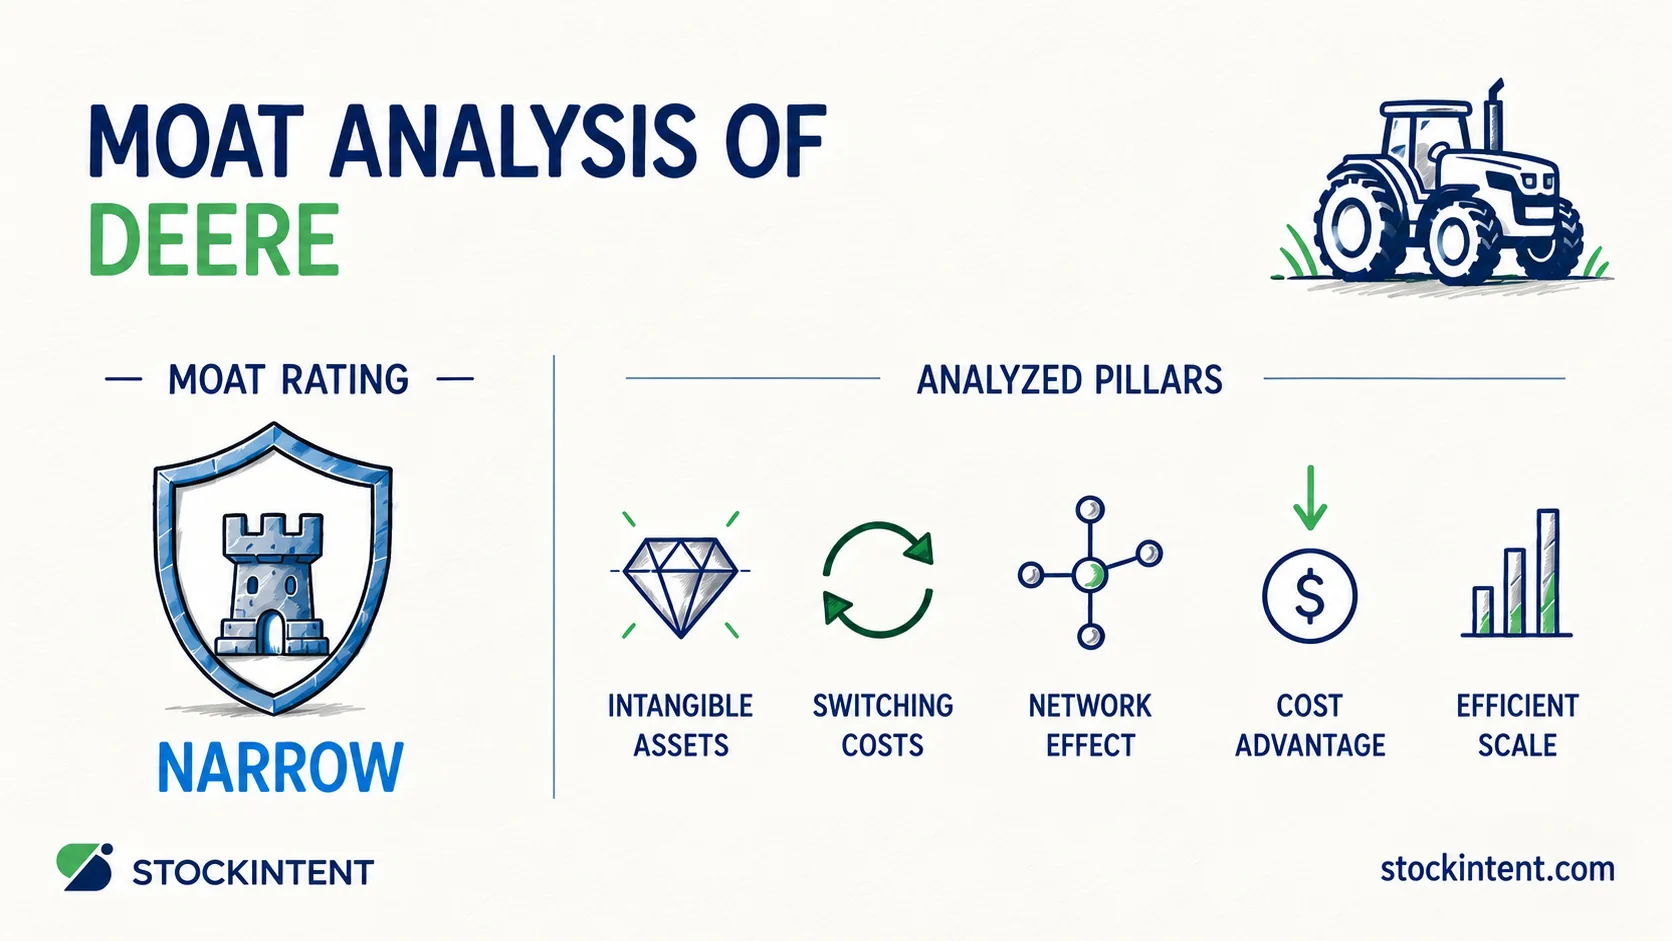
We rate Deere's economic moat as narrow, with a stable trend and medium uncertainty. The moat rests mainly on customer switching costs from its precision-agriculture ecosystem. It also benefits from valuable brand reputation and an established dealer network.
Financial performance supports this view. Equipment operations posted an operating margin of about 16.9% in fiscal Q2 2026 and 14.4% in fiscal Q3. Deere held those margins during a tough farm-equipment downturn. Deere's Q3 2026 earnings release guided large-ag industry sales in the U.S. and Canada down 15% to 20%.
Meanwhile, the connected ecosystem has grown to roughly 1.2 million connected machines and 520+ million engaged acres. That installed base forms the foundation of Deere's customer stickiness.
Here are our key takeaways:
A durable moat protects long-term returns on capital. That durability separates compounders from businesses that fade. Here is how Deere stacks up across all five competitive pillars.
A recognizable brand does not guarantee strong shareholder returns. Many popular brands deliver mediocre numbers once rivals close the quality gap. We evaluate each pillar directly to avoid confusing brand familiarity with true economic protection.
High switching costs provide Deere's clearest economic advantage. Once a farm runs on connected machinery, Operations Center software, and years of agronomic data, moving to AGCO or CNH requires rebuilding workflows from scratch.
According to Business Model Analyst's 2026 breakdown, Deere reports roughly 1.2 million connected machines and over 520 million engaged acres on its Operations Center platform. That footprint turns a single equipment purchase into an ongoing software commitment. Local dealer relationships reinforce this advantage, since prompt parts access and service uptime make staying with one fleet far simpler.
Deere commands pricing power in high-horsepower equipment. That strength appears clearly in secondary markets. Beanvest's 2026 moat analysis notes that brand reputation, dealer trust, and strong resale value create measurable intangible advantages.
Because Deere machinery holds its value well at trade-in, a farmer's total cost of ownership stays competitive despite a higher initial price. That pricing power reflects decades of built-up customer trust.
Large procurement volume, a vast manufacturing footprint, and dealer scale yield real cost benefits. However, independent evidence for a standalone cost moat remains limited. Most of these benefits overlap with the installed base and dealer network we already evaluated.
Many market commentary pieces label Deere's digital tools as a network effect. We view that as inaccurate, and prefer characterizing the system as data stickiness rather than a two-sided network.
One farmer enrolling acres in Operations Center does not automatically make the software more valuable to a neighbor. The workflow lock-in is real, but the mechanics do not match a true network effect.
Deere does not operate as a natural monopoly. Competitors bid and build across nearly every equipment line. Deere's primary edge stems from software and hardware integration, not from a market scale barrier that locks competitors out.
Switching costs and intangibles support our narrow rating, while the other three categories fall short. We can next examine how these advantages show up in Deere's financial statements.
A competitive advantage must show up in financial results. Deere's moat appears in three specific areas: pricing, operating margins, and capital efficiency.
First, consider pricing. In its Q3 2026 earnings call transcript, Deere projected net price realization of 1.5% to 2% for equipment operations in fiscal 2026. Preserving pricing gains during a farm equipment slowdown demonstrates genuine pricing power.
Margin resilience tells a similar story. Following Q3 results, management raised full-year net income guidance to $4.75–$5.0 billion. A 40% year-over-year reduction in high-horsepower tractor inventories helped balance factory output with retail demand.
Capital efficiency also remains sound. Return on equity reached nearly 19% over the past twelve months. Koalagains' competitive analysis rates Deere's margins and capital efficiency higher than AGCO's and CNH's. The report notes CNH trades at lower valuation multiples but carries lower pricing power and higher debt.
You can review these figures yourself. Our company reports compare Deere's historical margins and key metrics directly against AGCO and CNH.
We must note two operational caveats. Large-ag equipment volumes continue to decline across Europe and South America. Furthermore, recent margin performance gained temporary help from a tariff refund and the expiration of past dealer incentives.
We rate the moat trend as stable. Precision-agriculture gains are widening Deere's moat slightly, but cyclical hardware sales remain flat. On balance, the overall business does not yet justify a widening rating.
Adoption trends in precision tools remain encouraging. On the Q3 fiscal 2026 earnings call, management reported that one-third of North American sprayer orders included See & Spray, and roughly 40% of planters included advanced technology options. Each added system deepens customer switching costs.
Two factors prevent an upgraded trend rating. Agriculture remains inherently cyclical. As Koalagains' 2026 moat analysis notes, some recent resilience reflects production discipline rather than a structural market shift.
In addition, a July 2026 industry update notes that Deere holds roughly 34.9% of the agricultural machinery market. While Deere leads AGCO and CNH comfortably, one peer comparison suggests slight market share slippage from last year.
We monitor four key indicators to track Deere's progress over the next three to five years:
Our watchlists track how these metrics affect Deere's top-line revenue, operating margins, and free cash flow.
We assign Deere a medium uncertainty rating. We expect Deere to defend its market leadership, but the range of potential outcomes remains broad.
Uncertainty reflects the predictability of underlying business fundamentals rather than day-to-day stock volatility. Deere enjoys more diversification than single-segment equipment builders. Its construction, forestry, and road-building divisions help offset farm cyclicality, even as North American large-ag industry sales fall 15% to 20% in fiscal 2026.
Financial discipline keeps the balance sheet sound. In March 2026, Fitch affirmed Deere at 'A+' with a Stable outlook, citing conservative capital allocation while tracking debt levels through the agricultural cycle.
Three main risks widen the spread of possible outcomes. Deere cited about $1.2 billion in direct tariff exposure for 2026, creating a roughly 3% margin headwind. Demand in Europe and South America also remains soft. Finally, if farmers pause precision upgrades during an extended recession, operating margins could contract.
Deere maintains a narrow moat, a stable trend, and a medium uncertainty rating. Double-digit equipment margins through an industry downturn, a 19% return on equity, and an extensive dealer network validate its competitive strength.
Two variables will determine future performance. We will watch whether connected acres and precision adoption generate more recurring software revenue. We will also monitor whether $1.2 billion in tariff exposure and soft international demand erode profit margins.
Sustained market share losses or slower digital adoption could warrant a negative trend revision. Conversely, a higher mix of high-margin recurring software revenue would build a case for an upgraded moat rating.
We recommend tracking our four watchlist indicators each quarter. Let underlying operational data guide your investment thesis.
This article is for informational and educational purposes only and does not constitute investment advice.
Start your 7-day free trial and find quality compounders faster.
— StockIntent Score ╌ S&P 500