Oct 13, 2026
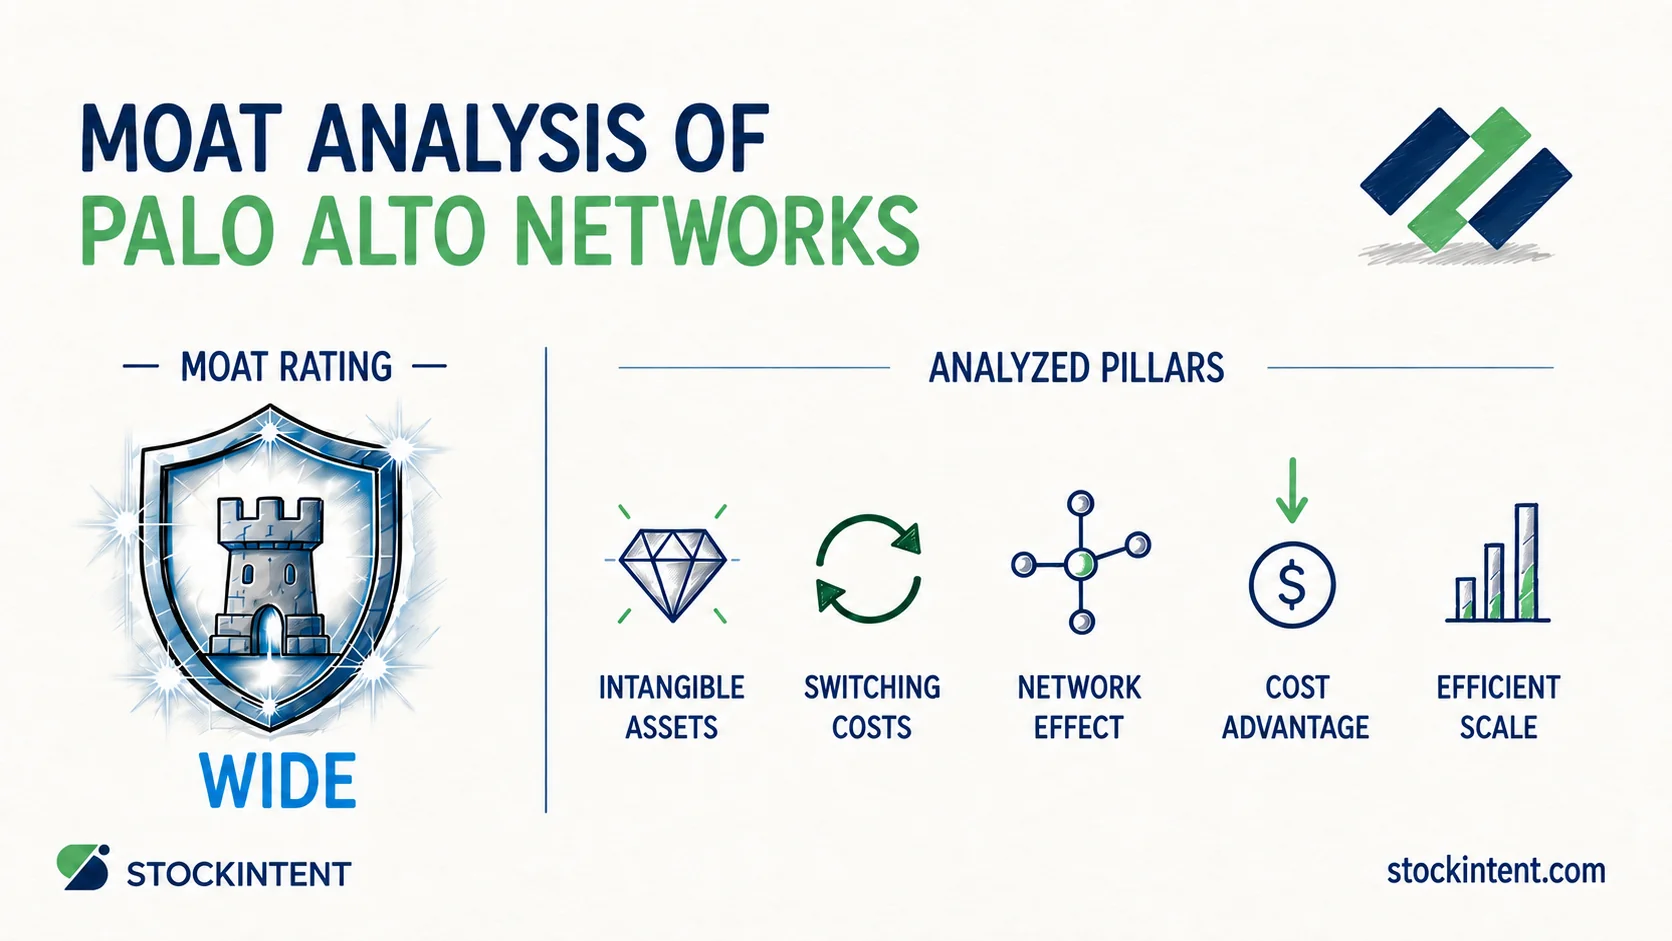
Palo Alto Networks possesses a wide economic moat with a stable-to-widening trend and medium uncertainty, backed by mission-critical cybersecurity architecture that locks in enterprise clients.
In fiscal 2026, the company reported $11.5 billion in revenue, up 24% year over year. Next-Generation Security ARR surged 63% to $9.10 billion, while remaining performance obligations reached $21.2 billion, up 34%. Adjusted free cash flow finished at $4.41 billion, delivering an adjusted margin of 38.4%. These numbers reflect an expanding platform footprint across global IT estates.
Here are our key findings:
For business owners and long-term investors, identifying durable structural moats matters because sustained competitive advantages defend capital returns.
An economic moat does not predict short-term market reactions; it measures whether a business can generate excess returns on invested capital over decades. To see where that protection originates, we evaluate Palo Alto Networks across five foundational moat pillars, ranked from strongest to weakest.
High switching costs represent the primary foundation of the company's competitive advantage. Morningstar's 2026 assessment attributes Palo Alto Networks's wide moat primarily to these steep friction barriers.
When an enterprise deploys the vendor's platform, the integration weaves directly into core operational architecture. Replacing network security firewalls, cloud policies, and Security Operations Center workflows demands substantial capital, operational risk, and engineer retraining. A Chief Information Security Officer rarely risks mission-critical downtime or catastrophic vulnerabilities just to chase a modest discount from a standalone competitor. Multi-product platform contracts lock organizations into long integration cycles, making product displacement extraordinarily painful.
Proprietary threat data and established enterprise brand trust provide a secondary, moderate moat source. Operating across tens of thousands of global deployments generates an enormous volume of threat telemetry every minute. The company's automated security engines ingest these patterns, refine machine-learning detection models, and deploy countermeasures across its customer base in real time.
This accumulated operational intelligence provides genuine defensive utility. However, it lacks the legal exclusivity of patents or regulated monopolies. Competitors run their own global research labs, keeping intangible assets valuable but secondary to structural lock-in.
Industry commentators often argue that cybersecurity platforms enjoy direct network effects. Under this view, each additional enterprise contributing telemetry improves threat models for all other users.
Pro Insight: In our experience, investors routinely over-credit "data network effects" in enterprise software. A telemetry feedback loop enhances detection accuracy, but an existing customer does not gain direct utility simply because a peer across town signs up. Threat intelligence pooling represents a valuable engineering capability, not a self-reinforcing direct network effect.
Because this feedback loop lacks direct two-sided mechanics, we do not treat network effects as a core pillar of the moat.
Cost advantage remains a weak pillar. Recent fiscal 2026 financial commentary highlights persistent margin headwinds from cloud hosting fees and hardware component inflation, especially in storage and memory. Palo Alto Networks wins enterprise contracts through comprehensive product scope and architectural consolidation, not by operating as the lowest-cost provider.
Efficient scale does not apply here. The cybersecurity market is massive, growing, and contested by specialized vendors and hyperscale cloud providers. Natural market capacity constraints do not exist to protect incumbents from aggressive new entrants.
While these structural pillars outline theoretical defense, durable moats ultimately reveal themselves in operating numbers. Next, we examine whether Palo Alto Networks's actual financial performance reflects these competitive barriers.
Do these moat ratings survive contact with reported financial statements? For long-term investors, qualitative advantages only matter when they translate into durable customer retention, predictable cash flows, and defensible economics.
In fiscal 2026, switching costs appeared clearly in account-level behavior. According to the Palo Alto Networks Q4 FY2026 earnings presentation, platformized customers generated over 65% of Next-Generation Security ARR and maintained net revenue retention above 120%. When enterprise clients adopt cross-pillar architectures, they expand spending rather than swap vendors.
This platform adoption provides high forward revenue visibility. Contracted remaining performance obligations climbed 34% to $21.2 billion in fiscal 2026, with current RPO reaching $9.3 billion. Scale advantages also fueled cash generation, producing $4.41 billion in adjusted free cash flow at a 38.4% margin and expanding non-GAAP operating margin 40 basis points to 29.2%.
Yet the business numbers expose a genuine weakness: standalone pricing power remains unproven. In its Q4 and FY2026 financial report, Palo Alto Networks reported full-year gross margin slipped 60 basis points to 75.8%, with fourth-quarter gross margin dropping 100 basis points to 74.8%. Shift toward cloud-delivered software and hardware inflation compressed gross spreads, showing that platform growth still requires margin trade-offs.
Unlike specialized peers like CrowdStrike, Fortinet, or Zscaler, Palo Alto Networks defends its position through enterprise consolidation rather than premium pricing dominance. Investors evaluating this trade-off can review StockIntent company reports to inspect multi-year backlog and cash-flow metrics in one unified view. For the moat to keep widening, this underlying execution must stay intact.
Palo Alto Networks's economic moat trend is Widening, propelled by a structural market shift toward vendor consolidation rather than the strength of any single security product.
Enterprise buyers are actively replacing fragmented point tools with integrated architectures. That structural tailwind shows up directly in the company's operating velocity: Next-Generation Security ARR surged 63% in fiscal 2026, outpacing overall revenue growth of 24%. Meanwhile, contracted remaining performance obligations expanded 34% to $21.2 billion. On the Q4 FY2026 earnings call, management issued initial fiscal 2027 revenue guidance of $14.1 billion to $14.2 billion, pointing to durable 23% to 24% annual growth. Increased AI adoption is driving security spending into comprehensive architectures, while strategic additions like Console for AI workflows and integrated identity assets raise customer friction.
Still, investors should not treat this widening trend as an established certainty. Shares fell after both third-quarter and fourth-quarter earnings beats in fiscal 2026, showing persistent market skepticism regarding how long this elevated growth pace can last. If acquisitions fail to integrate smoothly or enterprise IT budgets tighten, multi-year platform momentum could slow.
To verify whether this widening trend remains on track over the next three to five years, monitor these four indicators:
Investors tracking these variables can use StockIntent watchlists to monitor growth and margin trends every quarter without rebuilding analysis from scratch.
Our uncertainty rating for Palo Alto Networks is Medium, reflecting high revenue visibility paired with an asymmetric range of downside operating outcomes.
Several factors keep the business predictable. A $21.2 billion contracted backlog and expanding Next-Generation Security ARR give management strong visibility into near-term demand. For fiscal 2027, leadership targeted revenue between $14.1 billion and $14.2 billion, alongside non-GAAP operating margins of 28.5% to 29.0% and an adjusted free cash flow margin near 38%. Management also guided diluted share count to 844 million to 847 million shares. These narrow guidance bands point to steady operating momentum.
However, uncertainty does not measure equity volatility; it measures the plausible dispersion of long-term business outcomes. On the downside, that dispersion widens quickly. Gross margins contracted to 75.8% for full-year fiscal 2026 and hit 74.8% in the fourth quarter, pressured by cloud delivery costs and component inflation. In its fiscal 2026 annual report summary, the company specifically flagged customer credit exposure, federal procurement delays, fierce competitive pricing, and the risk that rapid expansion rates could slow.
Technological cycles also shift quickly. If enterprise customers resist multi-product suites or if rapid AI iteration favors agile point solutions, Palo Alto Networks could struggle to prove genuine pricing power. We believe the company's competitive moat remains durable, but converting platform scale into lasting pricing power remains an open question.
Palo Alto Networks commands a wide economic moat with a Widening trend and a Medium uncertainty rating. That assessment rests on formidable switching costs: platformized accounts post net revenue retention above 120%, contracted backlog stands at $21.2 billion, and adjusted free cash flow margins remain strong at 38.4%.
Yet the most critical variable for long-term business owners is pricing power. Despite impressive enterprise platform adoption, gross margins contracted across fiscal 2026. The wide-moat thesis assumes consolidation eventually gives the vendor leverage over its customers. If gross margins continue falling or Next-Generation Security ARR growth decelerates toward legacy hardware rates, that assumption falls apart.
Investors should not rely on earnings beats alone to confirm business durability. Instead, track the quarterly watchlist outlined above—specifically ARR velocity, backlog conversion, and margin stability—to test whether the platformization thesis continues delivering structural protection.
Disclosure: This analysis is for informational and educational purposes only and does not constitute investment advice. The economic moat rating, trend, and uncertainty assessment reflect StockIntent's independent interpretation of company-reported data and third-party industry commentary as of fiscal 2026.
Start your 7-day free trial and find quality compounders faster.
— StockIntent Score ╌ S&P 500