Oct 4, 2026
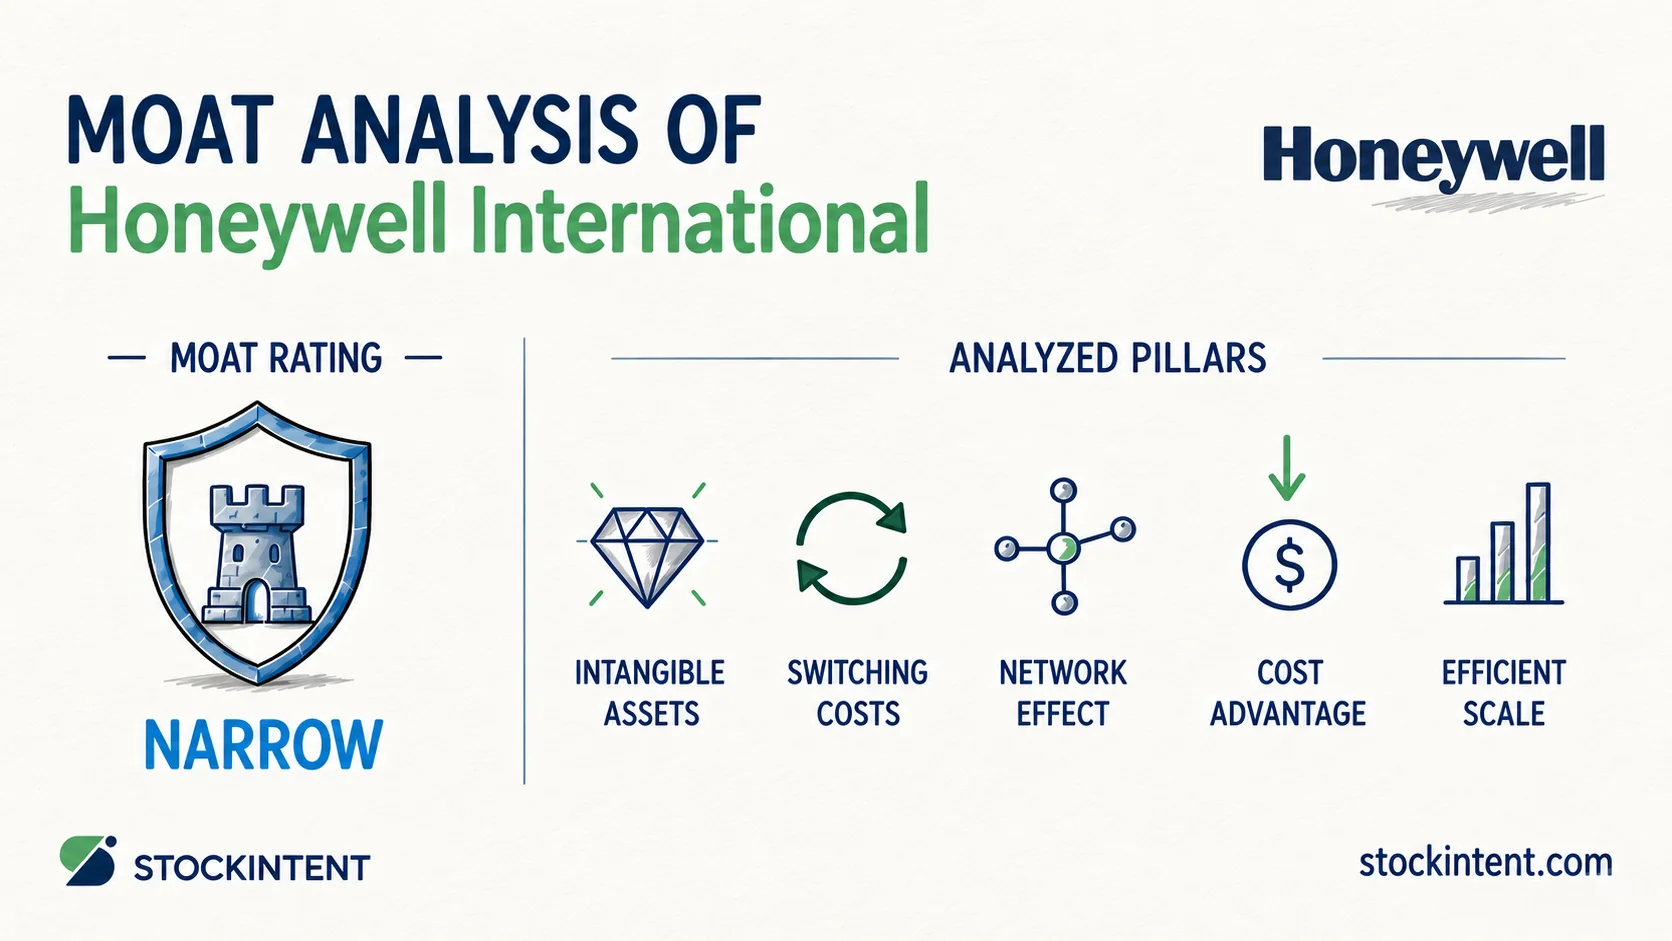
We assess Honeywell International as holding a narrow economic moat with a stable-to-modestly-widening trend and medium uncertainty. While the company operates deep within mission-critical industrial workflows, competitive durability varies significantly across its business lines rather than providing uniform protection.
Here is what matters most for long-term investors:
Evaluating economic moats is about verifying whether a business can defend excess returns on capital over decades. The following analysis breaks down Honeywell's moat pillars, real-world business results, and key forward risks.
To judge business quality over cheapness, we look at the durability of excess returns on capital. Honeywell does not rely on hype or brand buzz; its economic defense rests on deep operational integration across five classic competitive pillars.
Switching costs represent Honeywell's most potent competitive advantage. In its 2026 Investor Day presentation, management emphasized that the core automation businesses are engineered around monetizing a massive installed base. When an industrial plant, hospital, or data center installs Honeywell control architecture, ripping it out demands painful capital expense and intolerable operational downtime.
This friction compounds through software. Offerings connected to Honeywell Forge embed directly into customer workflows, creating recurring service streams that raise the switching barrier even higher. In the aerospace segment, an extensive global fleet of auxiliary power units (APUs) in active service locks in decades of aftermarket maintenance, parts, and specialized technical support.
Intangible assets serve as an equally durable pillar. Honeywell protects its market position through proprietary software, specialized engineering know-how, and decades of accumulated field data that cannot be copied from public domains. These operational datasets allow Honeywell to refine AI models specifically tuned for industrial efficiency.
Regulatory and qualification barriers reinforce this asset base. Products deployed in commercial aerospace, defense, and complex process manufacturing require rigorous safety certifications. These multi-year validation cycles make plant managers and aircraft manufacturers hesitant to swap proven Honeywell systems for unvetted alternatives.
Cost advantage provides moderate, localized support rather than a companywide structural edge. Honeywell is not a low-cost commodity manufacturer. Its cost efficiencies stem primarily from process discipline, platform leverage, and the sheer density of its service networks servicing existing equipment. These dynamics generate solid margins, but they remain supportive rather than decisive.
Efficient scale offers moderate to weak protection in selected sub-segments. Honeywell holds leading positions in niche aerospace systems and specialized process controls where demand can only support a handful of qualified suppliers. However, large rivals like Siemens and Schneider Electric actively contest most of its industrial and building automation markets, preventing true natural-monopoly dynamics.
Network effects are not material to Honeywell's economic moat. An additional facility adopting Honeywell building controls does not make the platform inherently more valuable to other building operators. The business delivers standalone industrial utility rather than a multi-sided user network.
From Our Experience: In our experience, industrial investors often conflate software and data attach with network effects. Honeywell's Forge platform creates genuine operating advantages, but those tools improve performance for the individual plant manager. They do not generate shared network utility where each new user adds value for everyone else. Distinguishing between product utility and collective network effects prevents investors from overstating moat width.
These structural advantages look compelling in theory, but competitive pillars only matter if they translate into durable corporate earnings.
Lock-in and switching costs prove their worth when customers keep buying through price hikes and inflationary pressure. In the first quarter of 2026, Honeywell reported 2% organic sales growth led primarily by pricing discipline, while segment margin expanded 90 basis points year over year to 23.3%. By the second quarter of 2026, organic sales rose 4% as segment margin climbed 100 basis points to 19%. Rather than chasing volume at the expense of returns, the business passed along higher input costs without bleeding customer accounts.
Order commitments highlight that retention. First-quarter 2026 orders expanded 7%, lifting the total backlog to roughly $38.3 billion. Second-quarter orders accelerated further, surging 16% organically with total backlog expanding 9%. Customers are committing capital quarters in advance, reinforcing revenue visibility.
Yet the moat does not protect every segment equally. In Q2 2026, Building Automation stood out with 9% organic sales growth and a 27.1% segment margin, benefiting from urgent demand in data centers, healthcare facilities, and fire safety systems. By contrast, Process Automation and Technology saw its segment margin contract 180 basis points to 22.1% due to lower catalyst volume and unfavorable product mix. When assessing these signals, StockIntent company reports help investors review segment margins, peer rankings, and multi-year operational trends across industrial peers in one clean workflow.
Context matters when interpreting these gains. While Honeywell maintains a competitive margin profile alongside peers like Siemens, Schneider Electric, and Emerson, part of its 2026 margin expansion reflects stranded-cost removals and restructuring ahead of the Aerospace separation. That operational friction reminds us that reported margin gains do not stem purely from customer lock-in.
We assess Honeywell's moat trend as stable to modestly widening. The business is systematically shedding non-core assets to focus on pure-play automation platforms, where customer integration is deepest and margins are most resilient.
Several developments are actively reinforcing this position. In the second quarter of 2026, organic orders grew 16%, driven by a standout 9% organic sales jump in Building Automation. Secular spending on data centers, healthcare infrastructure, and automated fire and life-safety systems is accelerating. As Honeywell spins off Aerospace and Advanced Materials, the remaining core becomes a cleaner industrial technology business. That sharper operational identity should strengthen pricing discipline and elevate software attach rates across its automation base.
At the same time, high-margin aftermarket services and long-cycle backlogs keep core operating cash flows stable. Customers cannot easily defer maintenance on mission-critical building controls or factory lines without risking expensive regulatory violations or plant shutdowns.
Pockets of weakness still exist. Process Automation experienced softness in mid-2026 as catalyst volumes dipped. More importantly, some recent margin progress reflects restructuring tailwinds and stranded-cost removals rather than purely organic competitive advantages. If post-separation execution stumbles, margin gains could quickly stall.
To verify whether this widening trend holds up organically over the next three to five years, investors should track four concrete signals:
While this trend points in a positive direction, assessing long-term durability also requires evaluating how confident we can be in that trajectory.
We assign Honeywell a medium uncertainty rating. A massive order book and sticky service contracts provide baseline stability, but major corporate separations and cyclical exposures widen the range of potential 3-to-5-year outcomes.
Several factors anchor downside protection. Management reaffirmed full-year 2026 guidance calling for $38.8 billion to $39.8 billion in revenue and 3% to 6% organic growth. That predictability is supported by Honeywell's $38.3 billion backlog, including about $19 billion in Aerospace with a healthy 1.1 book-to-bill. Meanwhile, raised guidance projecting 250 to 290 basis points of full-year margin expansion highlights solid underlying operational discipline.
Yet genuine headwinds widen Honeywell's outcome distribution. The planned Aerospace spin-off creates meaningful separation friction, while divesting lower-margin units like Productivity Solutions and Warehouse Workflow Solutions cuts roughly $400 million from 2026 sales. External shocks also sting; geopolitical conflict in the Middle East reduced Q1 revenue and slowed collections. Furthermore, reported GAAP operating margin fell to 16.1% in Q1 2026 due to repositioning costs and asset impairment charges, and the Quantinuum investment ramp remains excluded from baseline guidance.
Pro Insight: In our experience, headline GAAP swings tempt investors to overreact in both directions. First-quarter operating margin dropped to 16.1% even as underlying segment margins expanded. We treat that widening gap between reported and segment results as the single most critical uncertainty signal to track through the corporate separation.
Our assessment concludes that Honeywell International holds a narrow economic moat, a stable-to-modestly-widening moat trend, and a medium uncertainty rating. The core business defends itself through strong switching costs, proprietary industrial software, and sticky aftermarket relationships across a $38.3 billion order backlog. Pricing-led margin gains prove that customers remain willing to absorb higher costs rather than risk disruption to mission-critical operations.
From here, long-term investors should track two pivotal issues:
If Honeywell executes cleanly through its Aerospace separation while sustaining pricing leverage across its automation platforms, business quality will remain firmly intact.
This article is for informational and educational purposes only and is not investment advice.
Start your 7-day free trial and find quality compounders faster.
— StockIntent Score ╌ S&P 500