Oct 16, 2026
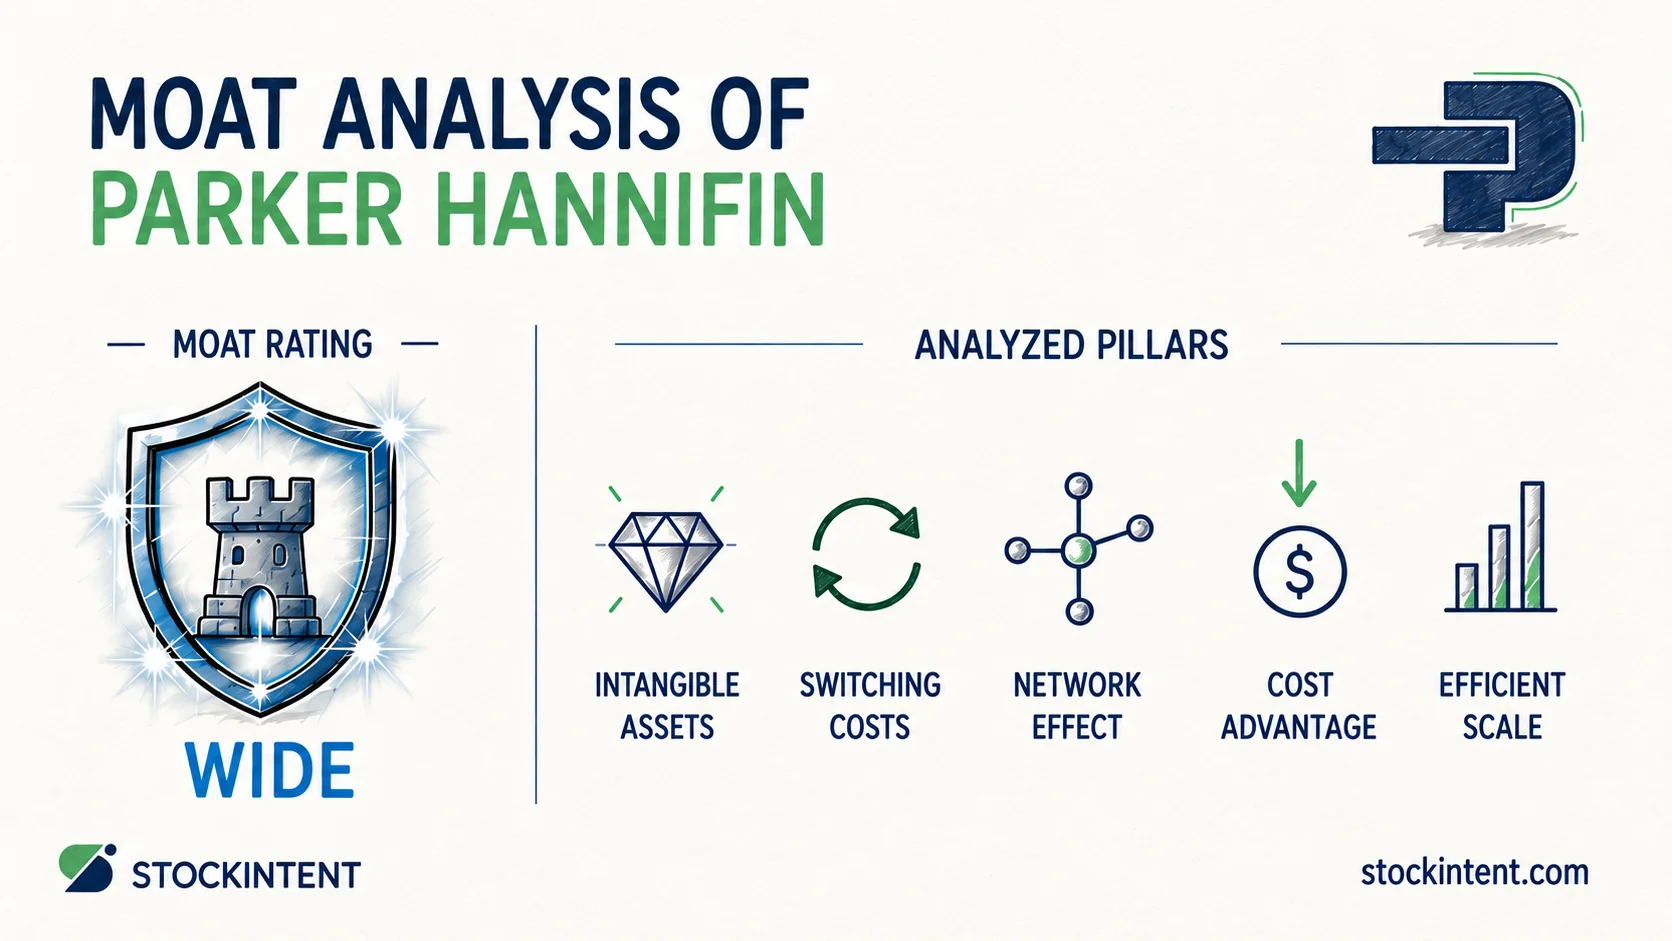
StockIntent rates Parker-Hannifin as a wide moat business with a Widening trend and Medium uncertainty. This moat rests on high switching costs for engineered components. Intangible assets and moderate scale advantages support it.
Fiscal 2026 sales hit a record $21.5 billion with 6.6% organic growth. Adjusted segment operating margins reached 27.3%, and operating cash flow totaled $4.4 billion.
Here are our primary takeaways:
Strong competitive advantages help companies defend excess returns over long horizons. Below, we break down each competitive pillar, review where the moat appears in financial results, and explain our conviction.
Motion-and-control businesses rarely draw strength from every traditional moat source. At Parker-Hannifin, one factor dominates, three provide secondary benefits, and one does not apply. We evaluate each of the five pillars below.
Parker designs parts directly into complex machinery, ranging from commercial aircraft hydraulics to automated factory lines. Replacing these components requires months of recertification, design revisions, and safety reviews. We see this dynamic as the company's core advantage.
Because replacing an approved part drains time and budget, buyers rarely switch suppliers over modest price differences. This stickiness protects margins in custom applications, even if standard catalog parts face more pricing pressure.
Parker carries significant balances of patents, proprietary designs, brand names, and customer contracts. Annual amortization on these assets runs into the hundreds of millions, according to the FY2026 annual report.
In markets driven by strict technical specifications, approved vendor status commands better pricing than generic hardware. When design engineers build Parker components into original equipment blueprints, they establish reliable replacement revenue for years.
S&P Global's 2026 research update points to Parker's disciplined operating costs. During a Citi investor conference, management credited regional manufacturing, automation, and lean production for their efficiency. We view these operational habits as sound management rather than an untouchable structural edge.
Operational gains are vulnerable to competition. Well-run peers can adopt similar automation and lean techniques, whereas replicating flight-safety certifications is far more difficult.
Scale provides benefits, but it does not deter competitors entirely. Parker sells across more than 100 product categories, spreading product development and administration over an expansive revenue base. What's the Moat's analysis points out that operating margins sit higher than typical capital-intensive industrial peers. That operating leverage helps, yet scaled competitors like Eaton maintain comparable manufacturing footprints.
Our review of Parker's 2026 financial filings revealed no platform dynamics, software networks, or collaborative data loops. The company generates value through precision hardware and direct client integrations instead of user network expansion.
Individual ratings provide useful context, but financial statements offer better proof of a durable advantage. Next, we examine where these competitive moats appear in the operating numbers.
Customer order patterns show the direct impact of Parker's high switching costs. The company's FY2026 annual report reported a record $12.8 billion backlog on June 30, 2026, up from $11.0 billion the prior year. Roughly 70% of those orders are scheduled for shipment within twelve months.
Aerospace Systems highlights this same commercial strength. Parker posted record aerospace revenue and forward bookings, with its annual 10-K linking margin gains directly to profitable aftermarket maintenance contracts.
Pricing power provides another signal. On the Q4 FY2026 earnings call, management confirmed that product price increases offset higher expenses across labor, logistics, and raw materials. That pricing power protects profitability across the primary catalog, though commodity lines offer less insulation.
Pro Insight: Moat analysis evaluates whether superior profitability can survive across an entire business cycle. Parker's 27% operating margins prove durable only if they withstand a sustained industrial slowdown.
Outside aerospace, the evidence for structural advantages is more mixed. Recent industrial margin expansion reflects favorable product mix and disciplined cost control alongside pricing gains. Furthermore, the long-term contribution from purchases like Filtration Group and CIRCOR aerospace assets was not fully clear in fiscal 2026 results. Compared with peers, Parker matches Eaton on operating discipline, while Danaher shows more predictable recurring demand and Honeywell offers broader market reach.
Investors can track operational metrics and historical performance using StockIntent company reports. We now turn to whether this competitive position is expanding or contracting.
We rate the moat trend as Widening. Management raised its FY31 adjusted segment operating margin target to 30% after beating its earlier 27% benchmark, indicating internal confidence in structural profitability (Q4 FY2026 earnings call). In 2026, S&P Global revised Parker's credit outlook to positive, citing strong operations and healthy cash flow projections.
Order trends support this rating. First-quarter fiscal 2026 bookings expanded 8% across all reporting units, lifting backlogs to $11.3 billion, and Q2 guidance increased margin expectations. Still, broader conditions warrant caution.
Diversified Industrial provided 67% of FY2026 revenue while Aerospace Systems generated 33%, according to the FY2026 Form 10-K. Recent momentum reflects commercial aerospace demand and post-destocking factory orders. Because cyclical rebounds end, our Widening rating depends on higher margin commitments and backlog depth rather than short-term volume.
Several developments could weaken this position:
We monitor four operational indicators:
Investors can use StockIntent watchlists to follow financial metrics like free cash generation, revenue trajectory, and operating margins. Operational changes, like contract awards and new order bookings, appear first in SEC filings and quarterly calls. We next evaluate the uncertainty around this business outlook.
We assign a Medium uncertainty rating. Steady aftermarket demand and a conservative balance sheet limit downside risks, yet industrial cyclicality and trade policy shifts prevent a Low uncertainty rating.
Balance sheet health supports our rating. As of March 31, 2026, S&P Global reported adjusted EBITDA margins of 27.4% and net leverage down to 1.6x. Operating forecasts point to mid-single-digit organic revenue expansion rather than erratic demand swings, and Parker's balanced market exposure limits single-sector shocks.
Other variables widen the range of outcomes. Aerospace and general manufacturing depend on economic cycles. Trade restrictions introduce operating friction, as seen in fiscal 2026 IEEPA tariff refunds, which alter near-term earnings. Margin expansion also requires disciplined product pricing once inflation cools. Merging acquired operations adds further execution risk.
Uncertainty reflects the distribution of business outcomes rather than everyday share price swings. We ask whether Parker's operating returns could deteriorate over the next five years. Our primary downside risk is margin compression during a slowdown rather than structural damage to the business. That distinction supports our Medium rating and informs portfolio sizing.
Parker-Hannifin holds a wide economic moat with a Widening trend and Medium uncertainty. This advantage rests on switching costs in certified engineered parts, supported by intangible assets and scale.
Two variables will shape performance from here. First, operating margins must prove their durability through an economic slowdown and normalized pricing. Second, market valuation leaves little room for operational missteps, requiring consistent execution to support current share prices.
We suggest tracking organic sales relative to peers and monitoring whether segment margins remain above historical averages. If those metrics stay steady through an industrial downturn, the thesis remains intact.
This content is for informational and educational purposes only and is not investment advice.
Start your 7-day free trial and find quality compounders faster.
— StockIntent Score ╌ S&P 500