Oct 5, 2026
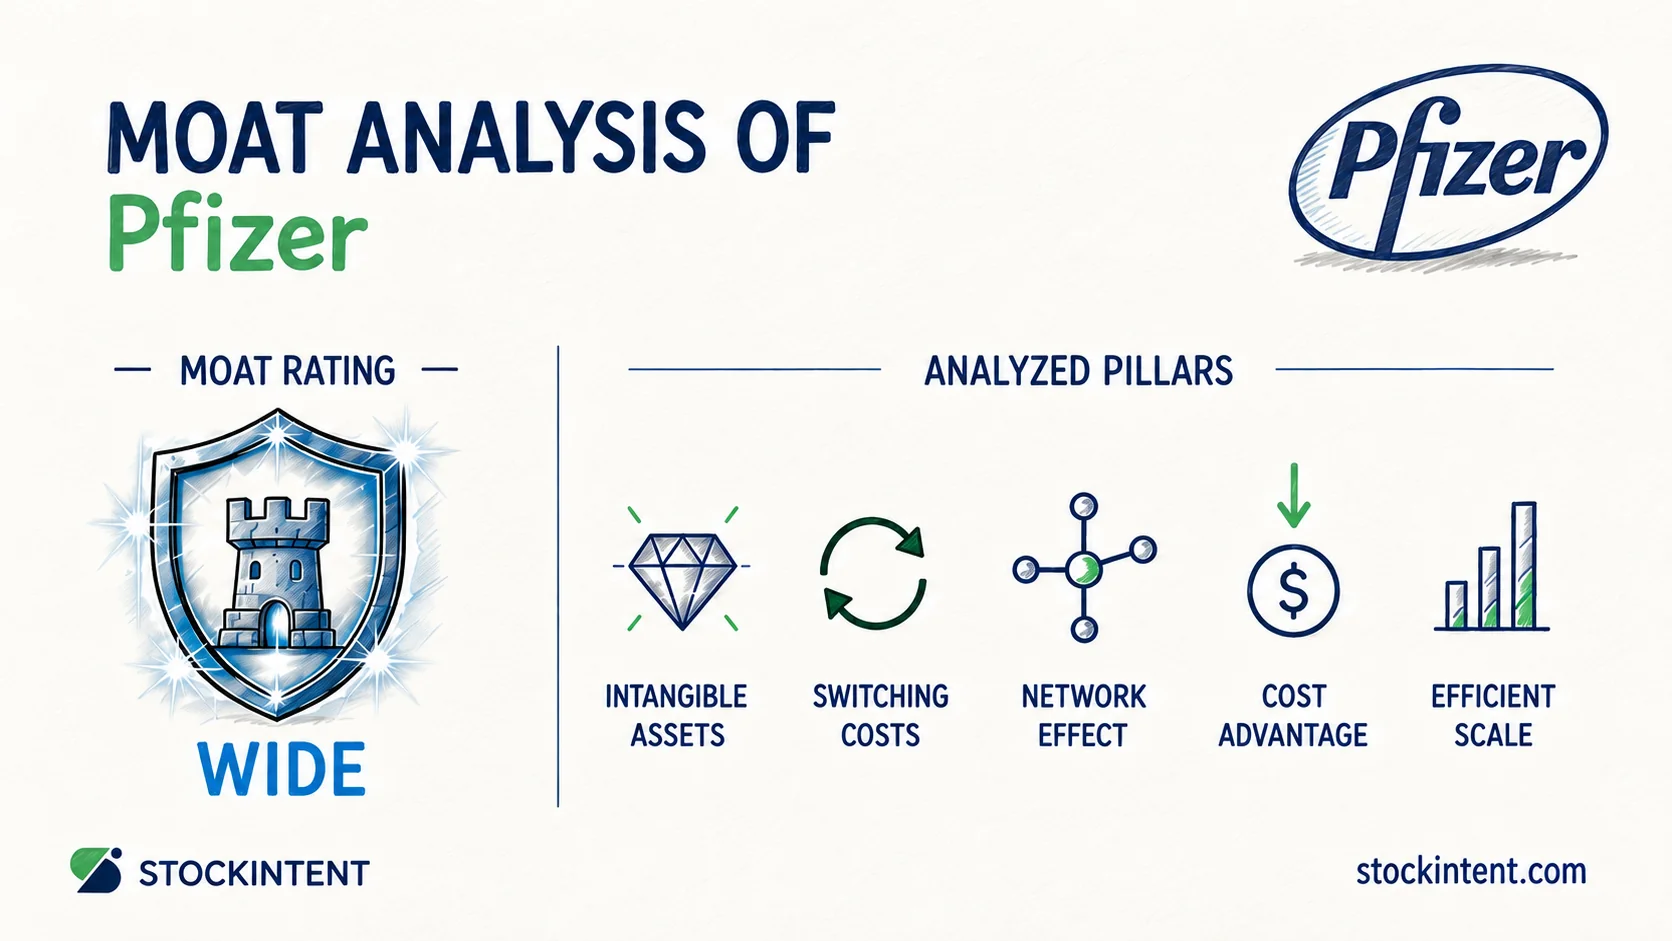
Pfizer holds a narrow economic moat with a weakening trend and medium uncertainty. While many investors assume a pharmaceutical heavyweight with tens of billions in sales enjoys a wide defensive moat, revenue scale alone does not guarantee durable pricing power or high returns on capital.
In 2026, Morningstar lowered Pfizer's moat rating from wide to narrow, pointing to pipeline setbacks, policy risks, and forecast returns on invested capital that only thinly clear its cost of capital.
Here are the core takeaways from our analysis:
Long-term compounders should judge Pfizer by its underlying competitive durability, not superficial cheapness or an optically high dividend yield. If reinvested capital cannot earn sustained excess returns, a cheap valuation is rarely a bargain.
Pfizer's economic moat functions primarily as a patent-and-data moat rather than a cost or network ecosystem. When we evaluate business quality, we focus on whether competitive advantages defend excess returns on invested capital over time. Scale alone does not preserve profitability if barriers to entry disappear once intellectual property rights expire.
Intangible assets serve as Pfizer's strongest competitive advantage. As detailed in Pfizer's 2025 Annual Report, proprietary patents, specialized regulatory exclusivities, clinical trial datasets, and therapeutic know-how form the legal framework shielding its branded portfolio from direct generic copies. That patent shield enables the company to command high gross margins on innovative drugs. However, the transient nature of intellectual property is clear in management's forward guidance. Company disclosures show that loss-of-exclusivity events represent an immediate drag, proving that the competitive advantage relies directly on active patent life.
From Our Experience: Investors often treat patent moats as permanent. They are actually a timer, not a wall: the protection expires on a known schedule, so the moat is really the pipeline's ability to replace what exclusivity temporarily grants. Pfizer is the live case study; its rating lives and dies with whether new protected products replace Eliquis- and Ibrance-class revenue before the clock runs out.
Switching costs provide a moderate, product-specific defensive layer. In specialized oncology regimens, complex hospital-administered therapeutics, and targeted vaccines, clinicians often hesitate to alter stable treatment protocols. Institutional formulary positioning and multi-year commercial payer contracts also generate practical friction against competing options. Yet these switching hurdles remain strictly product-specific. They rarely prevent generic substitution once a patent lapses, leaving core revenue exposed to standard bioequivalent alternatives.
Efficient scale provides limited, situational advantages rather than a company-wide barrier to entry. While Pfizer maintains extensive worldwide distribution, dedicated clinical testing infrastructure, and vast manufacturing plants, pharmaceutical development is rarely a natural monopoly. Well-capitalized peers routinely compete across every major therapeutic category. Scale facilitates complex global trials and cross-border commercial launches, but it cannot prevent rival firms from developing comparable therapies.
Cost advantage represents a weak pillar for Pfizer. Massive global manufacturing and bulk procurement deliver localized efficiencies, but they do not establish a durable, structural low-cost position across the overall portfolio. Competing in global pharma demands billions in recurring research and development along with aggressive commercialization spending. These heavy fixed costs leave operating profitability vulnerable during revenue transitions.
Network effects are not relevant to Pfizer's business model. A patient taking an oral therapeutic or receiving an immunization gains no direct utility when another patient receives the same prescription. Familiarity among physicians reflects commercial habit and standard medical training rather than a self-reinforcing network loop.
This distribution of competitive strengths explains why Pfizer's commercial durability remains closely tied to laboratory execution and patent lifecycle timing.
Pfizer's moat is most visible in its ability to defend massive revenue volume. Following solid second-quarter results, Pfizer raised the midpoint of its 2026 revenue guidance by $500 million to approximately $62 billion, within an updated range of $59.5 billion to $62.5 billion. Very few pharmaceutical companies possess the global footprint required to generate and sustain that volume of annual sales.
That top-line resilience functions largely through a commercialization engine capable of scaling acquired therapies. In the second quarter of 2026, investor presentation slides showed that acquired and recently launched products grew 25% operationally, generating $3.2 billion in quarterly revenue. Management noted that the Seagen acquisition continues to track ahead of initial expectations, led by robust uptake of oncology assets like Padcev.
Yet the classic financial traits of a wide moat—strong organic expansion and pricing power—remain elusive. Guidance of roughly $62 billion leaves the top line essentially flat compared to FY2025 revenue of approximately $62.6 billion. At the guidance midpoint, management expects roughly 4% operational revenue growth once COVID products and generic expirations are excluded. Meanwhile, Pfizer expects a $1.5 billion negative revenue impact in 2026 from products losing patent exclusivity.
Unlike peers like Eli Lilly and Novo Nordisk, which demonstrate clear category dominance and premium pricing power in metabolic disease, Pfizer relies heavily on volume and external acquisitions. The business remains large and resilient, but it is clearly in transition. That leaves investors facing an urgent question: is this multi-year portfolio makeover strengthening or weakening the firm's competitive moat?
Pfizer's economic moat trend is weakening. The company's underlying competitive position is shifting from broad, legacy primary-care scale toward specialized growth franchises. However, high-margin legacy cash flows are eroding faster than replacement therapies can establish durable pricing power. This dynamic directly underpins the moat downgrade discussed above.
While management is buying external innovation to patch exclusivity holes, the structural forces shaping Pfizer's moat pull in opposing directions:
Forces strengthening the moat:
Forces weakening the moat:
To determine whether this weakening trajectory stabilizes over the next three to five years, investors should monitor four measurable developments:
These four operational markers will reveal how wide the range of long-term business outcomes really is.
Our uncertainty rating for Pfizer is Medium. When assessing economic moats, uncertainty measures the plausible dispersion of fundamental business outcomes over a three-to-five-year period, not short-term share price volatility.
Near-term operations appear steady. Full-year 2026 revenue guidance of $59.5 billion to $62.5 billion provides a predictable baseline, supported by an adjusted gross margin in the mid-70% range and an adjusted operating margin near 35% reported in the second quarter of 2026. However, episodic product demand introduces variability. In that same earnings release, Pfizer cut its 2026 COVID revenue assumption to roughly $4 billion from approximately $5 billion. Low disease incidence limits Paxlovid utilization, while Comirnaty sales skew heavily toward late-year seasonal vaccination trends.
Balance-sheet leverage also remains elevated through this ongoing portfolio transition. For example, 2026 adjusted earnings absorbed a $0.10 per share in-process research charge from the Innovent transaction. Beyond deal accounting, Pfizer's 2025 annual filing highlights standard structural risks, including wholesale distributor concentration, supply chain counterfeiting, pricing reforms, foreign currency exposure, and climate-related disruptions.
These variables produce a moderately wide outcome range. A favorable scenario sees acquired therapies compound reliably and pipeline studies offset patent erosion. A bleaker scenario leaves Pfizer as an entrenched incumbent struggling with persistent generic headwinds. Because global distribution and product diversity shield the business from severe downside decay, a medium uncertainty rating best fits the evidence.
Pfizer enters the late 2020s with a narrow economic moat, a weakening trend, and a medium uncertainty rating. Intellectual property still shields tens of billions in branded sales, but patent exclusivity is a countdown clock rather than a permanent barrier.
Moving forward, two strategic questions matter most for fundamental investors:
Tracking these operating milestones requires disciplined monitoring rather than passive hope. You can track these shifting patent dynamics, revenue mix metrics, and pipeline developments using StockIntent watchlists.
This moat analysis is for informational and educational purposes only and does not constitute financial or investment advice.
Start your 7-day free trial and find quality compounders faster.
— StockIntent Score ╌ S&P 500