Royal Bank of Canada Economic Moat Analysis: Rating, Trend & Competitive Advantages

Royal Bank of Canada Economic Moat Analysis: Rating, Trend & Competitive Advantages

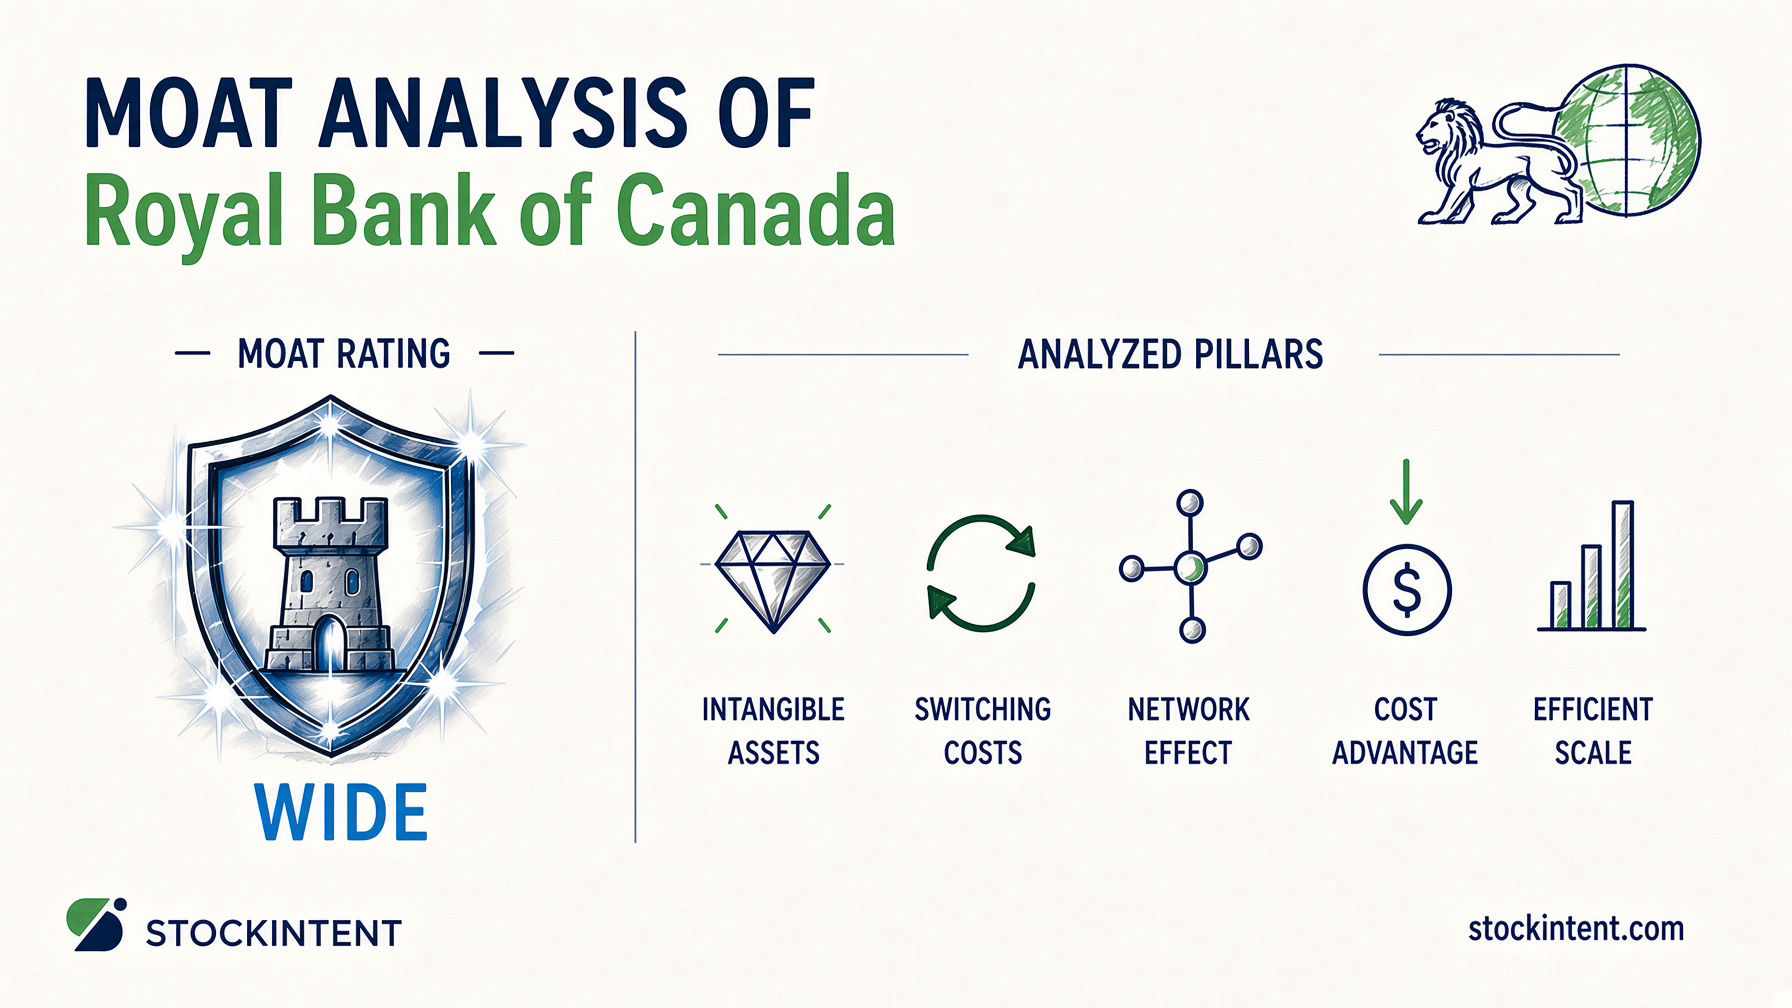
Royal Bank of Canada earns a Wide moat with a Stable trend and Medium uncertainty rating. In Q1 2026, RBC generated C$5.8 billion in net income, delivered a 17.6% return on equity, and held a 13.7% Common Equity Tier 1 ratio, all of which point to a durable, well-capitalized franchise. Morningstar independently confirms this view with its own wide moat rating.

Here's what matters most:

  • Strongest moat sources: Switching costs from embedded banking relationships and efficient scale from Canada's largest deposit base and a 32.9% efficiency ratio.
  • Main risk: Execution of the HSBC Canada integration and ongoing City National remediation could drag returns if mishandled.
  • Trend direction: Stable to slightly widening, supported by 25% year-over-year net income growth in Q2 2026 and over C$5 billion in annual technology investment.
  • Uncertainty level: Medium. Core banking is predictable, but capital markets exposure and macro shocks create meaningful outcome dispersion.

This analysis is about long-term business quality and whether RBC can sustain excess returns through cycles.

Royal Bank of Canada's Competitive Advantages

We evaluate RBC through the five classic moat pillars: switching costs, network effects, intangible assets, cost advantage, and efficient scale. Not every pillar matters equally for a bank, and RBC's strength is concentrated in just two of them.

Switching costs: strong. RBC's core moat rests on how deeply its services are embedded in customers' financial lives. Payroll deposits, mortgage relationships, business lending lines, and wealth advisory accounts all create real friction for anyone considering a move. The numbers back this up. RBC's deposit base is consistently described as "sticky" by analysts, and its Q1 2026 earnings release shows clear moat benefits through loan volume growth, favorable product mix, and improved net interest margin in Canadian Personal and Commercial Banking. When your paycheck, mortgage, and investment accounts all sit with one provider, switching becomes a complex project quickly.

Efficient scale: strong. RBC is Canada's largest bank, and that scale translates directly into economics. Its Q1 2026 investor presentation reports a 32.9% efficiency ratio and 1.7% operating leverage, both hallmarks of a bank that spreads fixed costs across an enormous revenue base. In Canada's concentrated banking oligopoly, being the biggest player means RBC can invest more, price competitively where it chooses, and still earn superior returns.

Cost advantage: moderate to strong. The HSBC Canada acquisition is already delivering cost synergies, according to RBC's Q4 2025 investor deck, while the bank maintains over C$5 billion in annual technology investment. That tech spend, combined with integration savings, creates a structural cost edge. Still, this advantage is partly borrowed from scale rather than uniquely protected. Competitors with similar size could replicate elements of it over time.

Intangible assets: moderate. Management emphasizes trust, brand, and security as differentiators in a risk-heavy environment, per Q1 2026 earnings call commentary. RBC describes itself as Canada's most valuable brand. That matters in banking, where customers prioritize reliability. But brand and trust lack legal protection, and they can erode faster than they build. This pillar supports the moat without defining it.

Network effects: weak to not material. Here's where we part from some popular narratives. RBC does not exhibit classic platform network effects. More users on its banking app do not make the service materially better for other users in the way that defines true network-effect businesses. The bank's distribution breadth, data scale, and ecosystem depth are better understood as extensions of efficient scale and switching costs, not as self-reinforcing network dynamics.

When you're reviewing detailed company reports to test these pillars yourself, look for efficiency ratios, growth trends, and profitability metrics that reveal how capital returns outsize competitors.

Why the Moat Matters: How It Shows Up in Business Performance

A moat is only as real as the numbers it produces. RBC's competitive advantages translate most clearly into two headline figures: a 17.6% ROE in Q1 2026 and a 17.2% ROE in Q2 2026. Returns at that level, sustained across consecutive quarters, suggest the bank is earning well above its cost of equity. That is the economic signature of a genuine moat.

The clearest evidence appears in Canadian Personal and Commercial Banking. Here, RBC reported loan volume growth, favorable product mix, and improved net interest margin in Q1 2026. These are not abstract strategic wins. They show customers accepting RBC's pricing, maintaining deposits, and expanding borrowing relationships. When a bank can expand margins while growing volumes, it is usually a sign of pricing power rooted in customer stickiness.

Wealth Management tells a similar story. Fee-based client assets grew through a combination of net sales and market appreciation. That distinction matters. Market-driven gains are not controlled by the bank's execution. Net sales reflect trust and relationship depth. RBC's ability to gather assets organically indicates customers view the bank as a long-term partner.

The picture gets more complicated in Capital Markets. RBC's diversified earnings helped deliver strong overall results, but this segment is inherently cyclical. A surge in trading or advisory revenue proves market position, not necessarily moat durability. As The Globe and Mail noted, capital markets earnings are "less moat-like" than retail deposit-driven businesses. We agree. Strong quarters here are welcome, but they do not carry the same predictive weight as sticky core banking relationships.

One other limitation is worth flagging. RBC's domestic franchise looks proven, but its U.S. growth quality is less clearly visible in the 2026 results. The moat appears strongest where RBC has spent decades building density, less certain where it is still expanding.

Compared to large Canadian peers, RBC's high-teens ROE and above-13% CET1 ratio place it in elite territory. The combination of diversified revenue, margin expansion in core banking, and organic wealth asset growth creates a business-quality profile that is hard to match.

Moat Trend: What Could Strengthen or Weaken the Moat?

RBC's moat is stable to slightly widening in 2026. The bank is not merely holding ground; it is translating scale into superior economics across every major segment. In Q2 2026, net income rose 25% year-over-year to C$5.5 billion, with diluted EPS up 27%. Growth was broad-based, touching Wealth Management, Personal Banking, Commercial Banking, and Capital Markets alike. That kind of breadth matters. A moat that shows up everywhere is harder to erode than one concentrated in a single line of business.

The stability case rests on structure, not just momentum. Canadian banking remains a regulated oligopoly where scale, low-cost deposits, and brand trust dominate. Morningstar's continued wide moat rating confirms that independent analysts see no deterioration in RBC's structural position. The bank's 13.7% CET1 ratio and roughly C$1 billion in Q1 share repurchases signal capital generation strong enough to invest, return cash, and still maintain a substantial buffer.

Still, moat trends deserve skepticism. The biggest near-term risk is execution. The HSBC Canada integration and ongoing City National remediation could absorb management attention and capital if they stumble. RBC's Q1 2026 investor materials explicitly flagged capital volatility tied to the HSBC closing. That is not a crisis, but it is a real variable. Macro uncertainty, including tariff and geopolitical risk flagged in RBC's economic outlook, adds another layer that scale alone cannot neutralize.

Patience matters here. Moat shifts unfold over years, not quarters. One strong earnings report does not widen a moat; sustained outperformance against peers does. The question is whether RBC's current momentum reflects durable advantage or cyclical tailwinds in capital markets and credit.

Here is what we are watching:

  • ROE and operating leverage versus peers. This is the cleanest test of whether scale still translates into superior economics. RBC's 17.6% Q1 and 17.2% Q2 ROE set a high bar.
  • Deposit growth and funding mix. Stable, low-cost deposits confirm the core moat.
  • Cross-sell depth across segments. Growth in clients using multiple RBC products strengthens switching costs and relationship stickiness.
  • Market share trends in core Canadian banking and wealth. Even without perfect disclosure, lending, deposit, and wealth asset trends will show whether RBC is gaining or losing ground where its moat is strongest.

These four indicators, tracked over multiple quarters, will tell us whether the stable-to-widening trend holds or starts to reverse.

Uncertainty Rating: How Confident Are We in This Moat Assessment?

We assign RBC a Medium uncertainty rating. The bank's core business is genuinely stable, but its earnings mix and near-term execution risks create a range of outcomes that is neither narrow enough for comfort nor wide enough to threaten the moat itself.

The predictability gradient across RBC's segments explains most of this. Canadian Personal and Commercial Banking is the bedrock. Management expects mid-single-digit net interest income growth excluding trading, driven by volume expansion and higher margins. That is about as steady as a large bank gets. Wealth Management sits in the middle. Fee revenue grows with client assets, but market appreciation and net sales introduce quarter-to-quarter variability. Capital Markets is the wildcard. RBC's Q1 and Q2 2026 results benefited from constructive conditions and elevated client activity, yet the bank itself noted seasonal patterns and offsetting weakness in certain trading areas. A bank with this mix is less cyclical than a pure investment bank, but more exposed than a plain retail lender.

Operating stability looks solid on the surface. RBC delivered 5% operating leverage in Q1 and over 3% in Q2, with record revenue across multiple businesses. The 13.7% CET1 ratio provides a genuine capital cushion above regulatory requirements. Still, the bank's own Q1 2026 investor materials flagged capital volatility tied to the HSBC Canada acquisition closing. That is a reminder that even strong balance sheets face friction from large integrations.

The risks that could widen outcomes are specific and worth naming. HSBC Canada execution remains the largest company-specific variable. Tariff uncertainty and geopolitical stress, flagged in RBC's own economic outlook, could dampen credit demand and client activity. Wealth Management fees would compress in a sustained downturn. Capital Markets revenue would follow trading volumes lower.

From our experience following Canadian banks through multiple credit cycles, RBC's medium uncertainty rating reflects the reality that even wide-moat banks face earnings volatility from capital markets exposure and macro shocks that core banking stability cannot fully offset. The 13.7% CET1 ratio provides a genuine buffer, but integration execution risk is a material variable that quantitative metrics alone cannot resolve.

The plausible range of outcomes over three to five years is moderately narrow-to-moderately wide. RBC's diversified earnings, scale, and recurring core demand should keep it in the top tier of Canadian banks under most scenarios. But a combination of weaker markets, slower growth, and integration missteps could compress fee revenue, strain capital, and reduce relative advantage.

For investors, the key is not expecting smooth quarterly progress. It is monitoring whether the underlying drivers of switching costs and efficient scale remain intact through the noise.

Bottom Line

Royal Bank of Canada holds a Wide moat with a Stable trend and Medium uncertainty rating. Its competitive strength rests on two load-bearing pillars: switching costs from deeply embedded customer relationships, and efficient scale from a 32.9% efficiency ratio and dominant position in Canada's concentrated banking oligopoly. The high-teens ROE delivered in both Q1 and Q2 2026 is the financial evidence that this moat still translates into durable excess returns.

The one issue that could change this view is execution risk. The HSBC Canada integration and City National remediation are not abstract concerns; RBC's own materials flagged capital volatility tied to the HSBC closing, and mishandled execution could absorb management bandwidth and compress returns for years. Sustained ROE compression below 15% would be a signal that the moat is weakening, not merely cyclical.

For investors who want to apply this framework beyond RBC, screening for wide-moat banks using fundamental criteria like ROE thresholds, efficiency ratios, and capital strength metrics is a practical next step. The goal is finding durable compounders where structural advantage shows up in the numbers, not just the strategy deck.

Royal Bank of Canada earns a Wide moat with a Stable trend and Medium uncertainty rating. In Q1 2026, RBC generated C$5.8 billion in net income, delivered a 17.6% return on equity, and held a 13.7% Common Equity Tier 1 ratio, all of which point to a durable, well-capitalized franchise. Morningstar independently confirms this view with its own wide moat rating.

Here's what matters most:

  • Strongest moat sources: Switching costs from embedded banking relationships and efficient scale from Canada's largest deposit base and a 32.9% efficiency ratio.
  • Main risk: Execution of the HSBC Canada integration and ongoing City National remediation could drag returns if mishandled.
  • Trend direction: Stable to slightly widening, supported by 25% year-over-year net income growth in Q2 2026 and over C$5 billion in annual technology investment.
  • Uncertainty level: Medium. Core banking is predictable, but capital markets exposure and macro shocks create meaningful outcome dispersion.

This analysis is about long-term business quality and whether RBC can sustain excess returns through cycles.

Royal Bank of Canada's Competitive Advantages

We evaluate RBC through the five classic moat pillars: switching costs, network effects, intangible assets, cost advantage, and efficient scale. Not every pillar matters equally for a bank, and RBC's strength is concentrated in just two of them.

Switching costs: strong. RBC's core moat rests on how deeply its services are embedded in customers' financial lives. Payroll deposits, mortgage relationships, business lending lines, and wealth advisory accounts all create real friction for anyone considering a move. The numbers back this up. RBC's deposit base is consistently described as "sticky" by analysts, and its Q1 2026 earnings release shows clear moat benefits through loan volume growth, favorable product mix, and improved net interest margin in Canadian Personal and Commercial Banking. When your paycheck, mortgage, and investment accounts all sit with one provider, switching becomes a complex project quickly.

Efficient scale: strong. RBC is Canada's largest bank, and that scale translates directly into economics. Its Q1 2026 investor presentation reports a 32.9% efficiency ratio and 1.7% operating leverage, both hallmarks of a bank that spreads fixed costs across an enormous revenue base. In Canada's concentrated banking oligopoly, being the biggest player means RBC can invest more, price competitively where it chooses, and still earn superior returns.

Cost advantage: moderate to strong. The HSBC Canada acquisition is already delivering cost synergies, according to RBC's Q4 2025 investor deck, while the bank maintains over C$5 billion in annual technology investment. That tech spend, combined with integration savings, creates a structural cost edge. Still, this advantage is partly borrowed from scale rather than uniquely protected. Competitors with similar size could replicate elements of it over time.

Intangible assets: moderate. Management emphasizes trust, brand, and security as differentiators in a risk-heavy environment, per Q1 2026 earnings call commentary. RBC describes itself as Canada's most valuable brand. That matters in banking, where customers prioritize reliability. But brand and trust lack legal protection, and they can erode faster than they build. This pillar supports the moat without defining it.

Network effects: weak to not material. Here's where we part from some popular narratives. RBC does not exhibit classic platform network effects. More users on its banking app do not make the service materially better for other users in the way that defines true network-effect businesses. The bank's distribution breadth, data scale, and ecosystem depth are better understood as extensions of efficient scale and switching costs, not as self-reinforcing network dynamics.

When you're reviewing detailed company reports to test these pillars yourself, look for efficiency ratios, growth trends, and profitability metrics that reveal how capital returns outsize competitors.

Why the Moat Matters: How It Shows Up in Business Performance

A moat is only as real as the numbers it produces. RBC's competitive advantages translate most clearly into two headline figures: a 17.6% ROE in Q1 2026 and a 17.2% ROE in Q2 2026. Returns at that level, sustained across consecutive quarters, suggest the bank is earning well above its cost of equity. That is the economic signature of a genuine moat.

The clearest evidence appears in Canadian Personal and Commercial Banking. Here, RBC reported loan volume growth, favorable product mix, and improved net interest margin in Q1 2026. These are not abstract strategic wins. They show customers accepting RBC's pricing, maintaining deposits, and expanding borrowing relationships. When a bank can expand margins while growing volumes, it is usually a sign of pricing power rooted in customer stickiness.

Wealth Management tells a similar story. Fee-based client assets grew through a combination of net sales and market appreciation. That distinction matters. Market-driven gains are not controlled by the bank's execution. Net sales reflect trust and relationship depth. RBC's ability to gather assets organically indicates customers view the bank as a long-term partner.

The picture gets more complicated in Capital Markets. RBC's diversified earnings helped deliver strong overall results, but this segment is inherently cyclical. A surge in trading or advisory revenue proves market position, not necessarily moat durability. As The Globe and Mail noted, capital markets earnings are "less moat-like" than retail deposit-driven businesses. We agree. Strong quarters here are welcome, but they do not carry the same predictive weight as sticky core banking relationships.

One other limitation is worth flagging. RBC's domestic franchise looks proven, but its U.S. growth quality is less clearly visible in the 2026 results. The moat appears strongest where RBC has spent decades building density, less certain where it is still expanding.

Compared to large Canadian peers, RBC's high-teens ROE and above-13% CET1 ratio place it in elite territory. The combination of diversified revenue, margin expansion in core banking, and organic wealth asset growth creates a business-quality profile that is hard to match.

Moat Trend: What Could Strengthen or Weaken the Moat?

RBC's moat is stable to slightly widening in 2026. The bank is not merely holding ground; it is translating scale into superior economics across every major segment. In Q2 2026, net income rose 25% year-over-year to C$5.5 billion, with diluted EPS up 27%. Growth was broad-based, touching Wealth Management, Personal Banking, Commercial Banking, and Capital Markets alike. That kind of breadth matters. A moat that shows up everywhere is harder to erode than one concentrated in a single line of business.

The stability case rests on structure, not just momentum. Canadian banking remains a regulated oligopoly where scale, low-cost deposits, and brand trust dominate. Morningstar's continued wide moat rating confirms that independent analysts see no deterioration in RBC's structural position. The bank's 13.7% CET1 ratio and roughly C$1 billion in Q1 share repurchases signal capital generation strong enough to invest, return cash, and still maintain a substantial buffer.

Still, moat trends deserve skepticism. The biggest near-term risk is execution. The HSBC Canada integration and ongoing City National remediation could absorb management attention and capital if they stumble. RBC's Q1 2026 investor materials explicitly flagged capital volatility tied to the HSBC closing. That is not a crisis, but it is a real variable. Macro uncertainty, including tariff and geopolitical risk flagged in RBC's economic outlook, adds another layer that scale alone cannot neutralize.

Patience matters here. Moat shifts unfold over years, not quarters. One strong earnings report does not widen a moat; sustained outperformance against peers does. The question is whether RBC's current momentum reflects durable advantage or cyclical tailwinds in capital markets and credit.

Here is what we are watching:

  • ROE and operating leverage versus peers. This is the cleanest test of whether scale still translates into superior economics. RBC's 17.6% Q1 and 17.2% Q2 ROE set a high bar.
  • Deposit growth and funding mix. Stable, low-cost deposits confirm the core moat.
  • Cross-sell depth across segments. Growth in clients using multiple RBC products strengthens switching costs and relationship stickiness.
  • Market share trends in core Canadian banking and wealth. Even without perfect disclosure, lending, deposit, and wealth asset trends will show whether RBC is gaining or losing ground where its moat is strongest.

These four indicators, tracked over multiple quarters, will tell us whether the stable-to-widening trend holds or starts to reverse.

Uncertainty Rating: How Confident Are We in This Moat Assessment?

We assign RBC a Medium uncertainty rating. The bank's core business is genuinely stable, but its earnings mix and near-term execution risks create a range of outcomes that is neither narrow enough for comfort nor wide enough to threaten the moat itself.

The predictability gradient across RBC's segments explains most of this. Canadian Personal and Commercial Banking is the bedrock. Management expects mid-single-digit net interest income growth excluding trading, driven by volume expansion and higher margins. That is about as steady as a large bank gets. Wealth Management sits in the middle. Fee revenue grows with client assets, but market appreciation and net sales introduce quarter-to-quarter variability. Capital Markets is the wildcard. RBC's Q1 and Q2 2026 results benefited from constructive conditions and elevated client activity, yet the bank itself noted seasonal patterns and offsetting weakness in certain trading areas. A bank with this mix is less cyclical than a pure investment bank, but more exposed than a plain retail lender.

Operating stability looks solid on the surface. RBC delivered 5% operating leverage in Q1 and over 3% in Q2, with record revenue across multiple businesses. The 13.7% CET1 ratio provides a genuine capital cushion above regulatory requirements. Still, the bank's own Q1 2026 investor materials flagged capital volatility tied to the HSBC Canada acquisition closing. That is a reminder that even strong balance sheets face friction from large integrations.

The risks that could widen outcomes are specific and worth naming. HSBC Canada execution remains the largest company-specific variable. Tariff uncertainty and geopolitical stress, flagged in RBC's own economic outlook, could dampen credit demand and client activity. Wealth Management fees would compress in a sustained downturn. Capital Markets revenue would follow trading volumes lower.

From our experience following Canadian banks through multiple credit cycles, RBC's medium uncertainty rating reflects the reality that even wide-moat banks face earnings volatility from capital markets exposure and macro shocks that core banking stability cannot fully offset. The 13.7% CET1 ratio provides a genuine buffer, but integration execution risk is a material variable that quantitative metrics alone cannot resolve.

The plausible range of outcomes over three to five years is moderately narrow-to-moderately wide. RBC's diversified earnings, scale, and recurring core demand should keep it in the top tier of Canadian banks under most scenarios. But a combination of weaker markets, slower growth, and integration missteps could compress fee revenue, strain capital, and reduce relative advantage.

For investors, the key is not expecting smooth quarterly progress. It is monitoring whether the underlying drivers of switching costs and efficient scale remain intact through the noise.

Bottom Line

Royal Bank of Canada holds a Wide moat with a Stable trend and Medium uncertainty rating. Its competitive strength rests on two load-bearing pillars: switching costs from deeply embedded customer relationships, and efficient scale from a 32.9% efficiency ratio and dominant position in Canada's concentrated banking oligopoly. The high-teens ROE delivered in both Q1 and Q2 2026 is the financial evidence that this moat still translates into durable excess returns.

The one issue that could change this view is execution risk. The HSBC Canada integration and City National remediation are not abstract concerns; RBC's own materials flagged capital volatility tied to the HSBC closing, and mishandled execution could absorb management bandwidth and compress returns for years. Sustained ROE compression below 15% would be a signal that the moat is weakening, not merely cyclical.

For investors who want to apply this framework beyond RBC, screening for wide-moat banks using fundamental criteria like ROE thresholds, efficiency ratios, and capital strength metrics is a practical next step. The goal is finding durable compounders where structural advantage shows up in the numbers, not just the strategy deck.