Wells Fargo Economic Moat Analysis: Rating, Trend & Competitive Advantages

Wells Fargo Economic Moat Analysis: Rating, Trend & Competitive Advantages

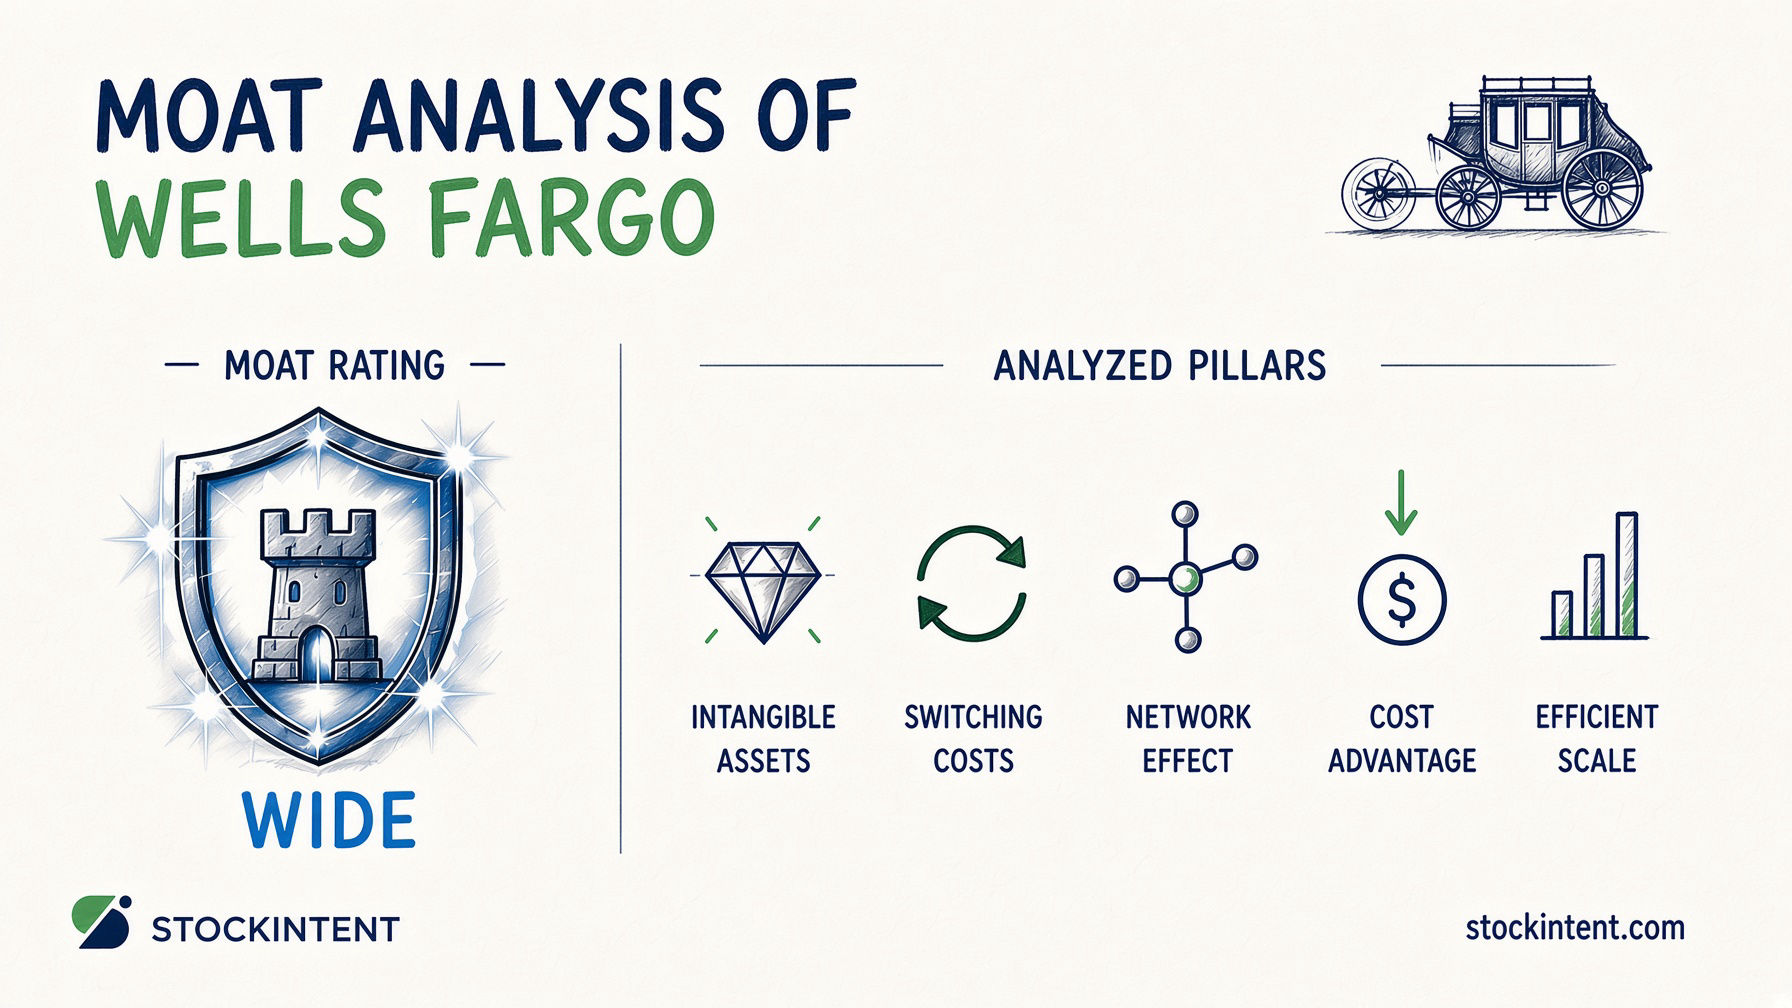
Wells Fargo is a wide-moat bank. Morningstar assigns it the highest moat tier based on customer switching costs in core banking, a structural funding-cost advantage, and intangible assets in wealth management. The moat's trajectory looks stable-to-widening after the Federal Reserve lifted the asset cap in mid-2025, though we rate the uncertainty around that path as medium.

Here are the four things every investor should know before digging into the details:

  • Strongest moat sources: Customer switching costs in checking, deposits, and treasury services, plus a decade-long record of funding its balance sheet cheaper than most peers.
  • Main risk: Near-term net interest margin compression and execution risk as management tries to convert post-asset-cap freedom into profitable growth.
  • Moat trend: Stable-to-widening. The regulatory ceiling is gone, but fee businesses, digital capabilities, and reputation are still catching up.
  • Uncertainty: Medium. Macro sensitivity, quarterly earnings variability, and the bank's own history of compliance issues keep the range of outcomes fairly wide.

Why does this matter? A moat is not a buy signal. It is a statement about business quality. Wells Fargo's ability to keep customers sticky and fund itself cheaply has supported returns above its cost of capital, and Morningstar projects a long-term return on equity of just over 13% against a 9% cost of equity. That spread is what durable compounding looks like, but it depends on execution staying sound.

Wells Fargo's Competitive Advantages

Wells Fargo's moat rests on two clearly visible pillars and one secondary support. The rest are either weak or not material for a bank of its kind. Here's how we assess each of the five classic moat pillars, ordered from strongest to weakest.

Switching costs: Strong. This is Wells Fargo's core advantage. Morningstar identifies customer switching costs in core banking as the bank's primary moat source, noting these operations supply the vast majority of profits. The mechanics are straightforward: a business does not uproot its checking accounts, treasury services, payroll, and payment rails because a competitor offers a slightly better savings rate. The friction is not just logistical. It is relational. Bankers know the customer's cash-flow patterns, credit needs, and industry quirks. That familiarity creates stickiness that pure pricing cannot easily disrupt.

Cost advantage: Strong. Wells Fargo has consistently paid less for balance-sheet funding than most competitors over the past decade, according to the same Morningstar analysis. It identifies funding costs as the bank's key source of advantage. This is not about being the biggest. It is about what the bank pays to keep deposits on its books. A cheaper funding base means wider net interest margins, more pricing flexibility, and better resilience when rates move against the industry. That advantage compounds over years in ways that headline asset growth rarely captures.

Pro Insight In banking, true network effects are rare compared to tech platforms. The real moat is in switching costs, customers rarely move checking accounts despite rate differences, and funding cost advantages from sticky deposits. Wells Fargo exemplifies this: its deposit franchise creates economics that fintechs struggle to replicate despite better user experience.

Intangible assets: Moderate. Morningstar includes intangible assets as a moat source, primarily in wealth management where relationships and trust matter more than balance-sheet scale. This is real but secondary. A wealthy family's multi-generational advisory relationship is valuable, yet it represents a smaller share of profits than the core deposit and payments franchise. The intangible asset pillar is present, but it is not carrying the moat.

Efficient scale: Weak and disputed. Wells Fargo is undeniably large, and some 2026 commentary emphasizes scale as part of the post-asset-cap investment thesis. But being big is not the same as possessing an efficient-scale moat. That pillar requires a market structure where a limited number of firms serve demand most efficiently, and where new entrants face a rational decision not to enter. The sources do not establish that Wells Fargo enjoys such a protected niche. Scale helps, but it is better understood as an amplifier of the cost advantage than as a standalone moat pillar.

Network effects: Not material. Our research does not support network effects as a meaningful moat driver for Wells Fargo. Banking has ecosystem effects, interbank networks, and payment rails where participation matters. Yet these are shared infrastructure, not proprietary network effects where each additional Wells Fargo customer makes the service materially more valuable for every other Wells Fargo customer.

When we evaluate these characteristics in depth, we find the evidence is clearest in the numbers: deposit costs, funding spreads, and customer retention rates that show up in quarterly filings, not strategy presentations. StockIntent's company reports let you review those financial statements to test whether the moat is visible where it counts.

Why the Moat Matters: How It Shows Up in Business Performance

Wells Fargo's moat is most visible in its funding economics, not in flashy growth metrics. In Q2 2026, net interest income excluding Markets rose 2% specifically because the bank paid less for deposits and attracted more interest-bearing commercial deposits. That is the cost advantage at work. The bank also maintained 2026 NII guidance of roughly $50 billion, suggesting management believes this franchise can generate steady earnings even as rates normalize.

Liquidity reinforces the story. Wells Fargo's Liquidity Coverage Ratio stood at 119% in Q2 2026, comfortably above the 100% regulatory floor. Its 2025 annual report showed $499.5 billion in central bank deposits and high-quality liquid debt securities. These buffers are not the moat itself, but they validate the deposit franchise that makes cheap, sticky funding possible.

Still, the moat is not equally visible everywhere. Management expects near-term net interest margin compression as the bank grows lower-yielding markets assets and shifts toward interest-bearing deposits. Wells Fargo also missed Q1 and Q2 2026 revenue expectations, which shows execution variability that a truly durable moat would typically smooth out. Fee businesses and wealth management are improving, but partly on market-driven tailwinds rather than pure franchise strength.

Pro Insight The critical question is whether management can reinvest the post-asset-cap growth wisely, converting regulatory relief into durable operating leverage rather than just growing for scale. The projected ROE of ~13% versus a 9% cost of equity shows the bank can generate returns above its cost of capital. Whether it actually does depends on capital allocation discipline though.

Compared with peers, Wells Fargo's clearest edge is in deposit depth and funding-cost advantage. Its position looks less differentiated in fee-rich businesses and broad organic growth. The moat is real and improving, but still most proven in core banking economics rather than across the entire franchise.

Moat Trend: What Could Strengthen or Weaken the Moat?

We rate the moat trend as stable-to-widening. The Federal Reserve lifted the asset cap in mid-2025, and that single regulatory change is the most important structural driver for Wells Fargo's competitive position today. It removes the ceiling that had constrained balance-sheet growth for years and lets the bank expand commercial lending, deposits, and capital markets activity more freely. Wedbush analysts described Wells Fargo as entering an "unshackled" phase in 2026, and the metaphor fits. A bank that could not grow is suddenly able to compete again.

But growth capacity is not the same as realized economics. Management expects near-term net interest margin compression as the bank shifts toward lower-yielding markets assets and interest-bearing deposits. In Q1 2026 materials, executives flagged this mix shift as a headwind. So the moat is widening in optionality and franchise reach, yet stable-to-mixed in the profit it actually produces quarter to quarter. That distinction matters for investors who might otherwise assume regulatory relief automatically means better returns.

Headcount has declined for 24 consecutive quarters as of Q2 2026. Management frames those savings as funding AI investments and cyber defense. That's the right trade-off on paper, technology can lower servicing costs and improve underwriting. Still, execution risk is real. If the spending does not convert into productivity gains, the cost rationalization becomes a short-term accounting win rather than a durable advantage.

The competitive landscape is intensifying. Wells Fargo is trying to regain share in premium credit cards, affluent banking, and options clearing against entrenched players like JPMorgan, American Express, and Goldman Sachs. Strategy slides cannot win those battles. Customer behavior is shifting toward bundled relationships, which could raise switching costs if cross-sell improves, but only if the products are competitive on their own merits.

Here are the four indicators we watch most closely to judge whether the trend is genuinely improving:

  • Net interest income trajectory. 2026 guidance sits at approximately $50 billion. If NII holds near that level while margin pressure eases, the moat is strengthening. Persistent misses would signal the opposite.
  • Efficiency ratio. Improvement from the low-60s toward the high-50s would show the bank converting scale into profit power, not just spending more to grow.
  • Loan, deposit, and card share gains. Durable share growth in commercial banking and affluent segments would indicate real franchise pull rather than price-driven customer acquisition.
  • Fee-income mix. Rising noninterest income from markets, wealth, and clearing would demonstrate the moat broadening beyond spread-dependent banking.

You can track metrics like these across Wells Fargo and comparable wide-moat banks with StockIntent's stock screener, filtering for efficiency trends, growth, and income profitability that reveal whether the operational story matches the strategic one.

Uncertainty Rating: How Confident Are We in This Moat Assessment?

We rate Wells Fargo's moat uncertainty as medium. The franchise has enough structural stability to avoid a high-uncertainty label, but enough moving parts to rule out low uncertainty as well.

On the positive side, management has provided explicit 2026 guidance: approximately $50 billion in net interest income and roughly $55.7 billion in noninterest expenses. That framework makes the bank easier to model than a transaction-dependent business. Revenue growth has also improved, with reported 2026 quarters showing 6% to 9% year-over-year increases.

But the evidence cuts both ways. Wells Fargo missed revenue and NII expectations in both Q1 and Q2 2026, and analysts point to trading revenue mix and fee income variability as ongoing swing factors. Management itself notes that NII depends on rates, the yield curve, deposit balances, pricing, and loan demand, all of which sit outside the bank's control.

The range of outcomes for Wells Fargo's competitive position over the next three to five years is moderately wide. If the bank sustains deposit growth, normalizes margins post-asset-cap, and converts its cost advantages into operating leverage, it could become a stronger, more consistent franchise. If NII compresses, deposit costs rise, or fee mix disappoints, it could end up looking more like a pedestrian large-bank competitor.

The assumptions behind the wide-moat assessment, switching costs and funding-cost advantages, are durable but not immune to disruption. Rising deposit competition from fintechs and money-market funds could narrow the funding-cost gap over time. For now, the moat is real but the boundaries are fuzzy enough that investors should expect surprises.

Bottom Line

Wells Fargo earns a wide moat rating with a stable-to-widening trend and medium uncertainty. That summary reflects what the evidence shows: customer switching costs and funding-cost advantages have proven durable across rate cycles, and the mid-2025 removal of the Federal Reserve asset cap restored growth capacity that had been missing for years.

The two issues that matter most from here are execution and margin trajectory. The bank must convert regulatory freedom into sustained operating leverage, not just bigger balance-sheet numbers. Near-term net interest margin compression and demonstrated variability in Q1 and Q2 2026 results show that execution is still catching up to opportunity.

Morningstar's projected long-term return on equity of just over 13% against a 9% cost of equity captures the bull case in a single number. The bear case, voiced by analysts who see current returns below the cost of capital, demands proof that the franchise can actually deliver those spreads. Both views are reasonable. Neither guarantees an outcome.

For investors, the moat assessment is a tool for judging business quality, not timing entry points. Wells Fargo's core economics are strong. Whether management turns that strength into durable compounding is the question the next few years will answer.

This content is for informational or educational purposes and is not investment advice. Investors should conduct their own research and consult qualified advisors before making investment decisions.

Wells Fargo is a wide-moat bank. Morningstar assigns it the highest moat tier based on customer switching costs in core banking, a structural funding-cost advantage, and intangible assets in wealth management. The moat's trajectory looks stable-to-widening after the Federal Reserve lifted the asset cap in mid-2025, though we rate the uncertainty around that path as medium.

Here are the four things every investor should know before digging into the details:

  • Strongest moat sources: Customer switching costs in checking, deposits, and treasury services, plus a decade-long record of funding its balance sheet cheaper than most peers.
  • Main risk: Near-term net interest margin compression and execution risk as management tries to convert post-asset-cap freedom into profitable growth.
  • Moat trend: Stable-to-widening. The regulatory ceiling is gone, but fee businesses, digital capabilities, and reputation are still catching up.
  • Uncertainty: Medium. Macro sensitivity, quarterly earnings variability, and the bank's own history of compliance issues keep the range of outcomes fairly wide.

Why does this matter? A moat is not a buy signal. It is a statement about business quality. Wells Fargo's ability to keep customers sticky and fund itself cheaply has supported returns above its cost of capital, and Morningstar projects a long-term return on equity of just over 13% against a 9% cost of equity. That spread is what durable compounding looks like, but it depends on execution staying sound.

Wells Fargo's Competitive Advantages

Wells Fargo's moat rests on two clearly visible pillars and one secondary support. The rest are either weak or not material for a bank of its kind. Here's how we assess each of the five classic moat pillars, ordered from strongest to weakest.

Switching costs: Strong. This is Wells Fargo's core advantage. Morningstar identifies customer switching costs in core banking as the bank's primary moat source, noting these operations supply the vast majority of profits. The mechanics are straightforward: a business does not uproot its checking accounts, treasury services, payroll, and payment rails because a competitor offers a slightly better savings rate. The friction is not just logistical. It is relational. Bankers know the customer's cash-flow patterns, credit needs, and industry quirks. That familiarity creates stickiness that pure pricing cannot easily disrupt.

Cost advantage: Strong. Wells Fargo has consistently paid less for balance-sheet funding than most competitors over the past decade, according to the same Morningstar analysis. It identifies funding costs as the bank's key source of advantage. This is not about being the biggest. It is about what the bank pays to keep deposits on its books. A cheaper funding base means wider net interest margins, more pricing flexibility, and better resilience when rates move against the industry. That advantage compounds over years in ways that headline asset growth rarely captures.

Pro Insight In banking, true network effects are rare compared to tech platforms. The real moat is in switching costs, customers rarely move checking accounts despite rate differences, and funding cost advantages from sticky deposits. Wells Fargo exemplifies this: its deposit franchise creates economics that fintechs struggle to replicate despite better user experience.

Intangible assets: Moderate. Morningstar includes intangible assets as a moat source, primarily in wealth management where relationships and trust matter more than balance-sheet scale. This is real but secondary. A wealthy family's multi-generational advisory relationship is valuable, yet it represents a smaller share of profits than the core deposit and payments franchise. The intangible asset pillar is present, but it is not carrying the moat.

Efficient scale: Weak and disputed. Wells Fargo is undeniably large, and some 2026 commentary emphasizes scale as part of the post-asset-cap investment thesis. But being big is not the same as possessing an efficient-scale moat. That pillar requires a market structure where a limited number of firms serve demand most efficiently, and where new entrants face a rational decision not to enter. The sources do not establish that Wells Fargo enjoys such a protected niche. Scale helps, but it is better understood as an amplifier of the cost advantage than as a standalone moat pillar.

Network effects: Not material. Our research does not support network effects as a meaningful moat driver for Wells Fargo. Banking has ecosystem effects, interbank networks, and payment rails where participation matters. Yet these are shared infrastructure, not proprietary network effects where each additional Wells Fargo customer makes the service materially more valuable for every other Wells Fargo customer.

When we evaluate these characteristics in depth, we find the evidence is clearest in the numbers: deposit costs, funding spreads, and customer retention rates that show up in quarterly filings, not strategy presentations. StockIntent's company reports let you review those financial statements to test whether the moat is visible where it counts.

Why the Moat Matters: How It Shows Up in Business Performance

Wells Fargo's moat is most visible in its funding economics, not in flashy growth metrics. In Q2 2026, net interest income excluding Markets rose 2% specifically because the bank paid less for deposits and attracted more interest-bearing commercial deposits. That is the cost advantage at work. The bank also maintained 2026 NII guidance of roughly $50 billion, suggesting management believes this franchise can generate steady earnings even as rates normalize.

Liquidity reinforces the story. Wells Fargo's Liquidity Coverage Ratio stood at 119% in Q2 2026, comfortably above the 100% regulatory floor. Its 2025 annual report showed $499.5 billion in central bank deposits and high-quality liquid debt securities. These buffers are not the moat itself, but they validate the deposit franchise that makes cheap, sticky funding possible.

Still, the moat is not equally visible everywhere. Management expects near-term net interest margin compression as the bank grows lower-yielding markets assets and shifts toward interest-bearing deposits. Wells Fargo also missed Q1 and Q2 2026 revenue expectations, which shows execution variability that a truly durable moat would typically smooth out. Fee businesses and wealth management are improving, but partly on market-driven tailwinds rather than pure franchise strength.

Pro Insight The critical question is whether management can reinvest the post-asset-cap growth wisely, converting regulatory relief into durable operating leverage rather than just growing for scale. The projected ROE of ~13% versus a 9% cost of equity shows the bank can generate returns above its cost of capital. Whether it actually does depends on capital allocation discipline though.

Compared with peers, Wells Fargo's clearest edge is in deposit depth and funding-cost advantage. Its position looks less differentiated in fee-rich businesses and broad organic growth. The moat is real and improving, but still most proven in core banking economics rather than across the entire franchise.

Moat Trend: What Could Strengthen or Weaken the Moat?

We rate the moat trend as stable-to-widening. The Federal Reserve lifted the asset cap in mid-2025, and that single regulatory change is the most important structural driver for Wells Fargo's competitive position today. It removes the ceiling that had constrained balance-sheet growth for years and lets the bank expand commercial lending, deposits, and capital markets activity more freely. Wedbush analysts described Wells Fargo as entering an "unshackled" phase in 2026, and the metaphor fits. A bank that could not grow is suddenly able to compete again.

But growth capacity is not the same as realized economics. Management expects near-term net interest margin compression as the bank shifts toward lower-yielding markets assets and interest-bearing deposits. In Q1 2026 materials, executives flagged this mix shift as a headwind. So the moat is widening in optionality and franchise reach, yet stable-to-mixed in the profit it actually produces quarter to quarter. That distinction matters for investors who might otherwise assume regulatory relief automatically means better returns.

Headcount has declined for 24 consecutive quarters as of Q2 2026. Management frames those savings as funding AI investments and cyber defense. That's the right trade-off on paper, technology can lower servicing costs and improve underwriting. Still, execution risk is real. If the spending does not convert into productivity gains, the cost rationalization becomes a short-term accounting win rather than a durable advantage.

The competitive landscape is intensifying. Wells Fargo is trying to regain share in premium credit cards, affluent banking, and options clearing against entrenched players like JPMorgan, American Express, and Goldman Sachs. Strategy slides cannot win those battles. Customer behavior is shifting toward bundled relationships, which could raise switching costs if cross-sell improves, but only if the products are competitive on their own merits.

Here are the four indicators we watch most closely to judge whether the trend is genuinely improving:

  • Net interest income trajectory. 2026 guidance sits at approximately $50 billion. If NII holds near that level while margin pressure eases, the moat is strengthening. Persistent misses would signal the opposite.
  • Efficiency ratio. Improvement from the low-60s toward the high-50s would show the bank converting scale into profit power, not just spending more to grow.
  • Loan, deposit, and card share gains. Durable share growth in commercial banking and affluent segments would indicate real franchise pull rather than price-driven customer acquisition.
  • Fee-income mix. Rising noninterest income from markets, wealth, and clearing would demonstrate the moat broadening beyond spread-dependent banking.

You can track metrics like these across Wells Fargo and comparable wide-moat banks with StockIntent's stock screener, filtering for efficiency trends, growth, and income profitability that reveal whether the operational story matches the strategic one.

Uncertainty Rating: How Confident Are We in This Moat Assessment?

We rate Wells Fargo's moat uncertainty as medium. The franchise has enough structural stability to avoid a high-uncertainty label, but enough moving parts to rule out low uncertainty as well.

On the positive side, management has provided explicit 2026 guidance: approximately $50 billion in net interest income and roughly $55.7 billion in noninterest expenses. That framework makes the bank easier to model than a transaction-dependent business. Revenue growth has also improved, with reported 2026 quarters showing 6% to 9% year-over-year increases.

But the evidence cuts both ways. Wells Fargo missed revenue and NII expectations in both Q1 and Q2 2026, and analysts point to trading revenue mix and fee income variability as ongoing swing factors. Management itself notes that NII depends on rates, the yield curve, deposit balances, pricing, and loan demand, all of which sit outside the bank's control.

The range of outcomes for Wells Fargo's competitive position over the next three to five years is moderately wide. If the bank sustains deposit growth, normalizes margins post-asset-cap, and converts its cost advantages into operating leverage, it could become a stronger, more consistent franchise. If NII compresses, deposit costs rise, or fee mix disappoints, it could end up looking more like a pedestrian large-bank competitor.

The assumptions behind the wide-moat assessment, switching costs and funding-cost advantages, are durable but not immune to disruption. Rising deposit competition from fintechs and money-market funds could narrow the funding-cost gap over time. For now, the moat is real but the boundaries are fuzzy enough that investors should expect surprises.

Bottom Line

Wells Fargo earns a wide moat rating with a stable-to-widening trend and medium uncertainty. That summary reflects what the evidence shows: customer switching costs and funding-cost advantages have proven durable across rate cycles, and the mid-2025 removal of the Federal Reserve asset cap restored growth capacity that had been missing for years.

The two issues that matter most from here are execution and margin trajectory. The bank must convert regulatory freedom into sustained operating leverage, not just bigger balance-sheet numbers. Near-term net interest margin compression and demonstrated variability in Q1 and Q2 2026 results show that execution is still catching up to opportunity.

Morningstar's projected long-term return on equity of just over 13% against a 9% cost of equity captures the bull case in a single number. The bear case, voiced by analysts who see current returns below the cost of capital, demands proof that the franchise can actually deliver those spreads. Both views are reasonable. Neither guarantees an outcome.

For investors, the moat assessment is a tool for judging business quality, not timing entry points. Wells Fargo's core economics are strong. Whether management turns that strength into durable compounding is the question the next few years will answer.

This content is for informational or educational purposes and is not investment advice. Investors should conduct their own research and consult qualified advisors before making investment decisions.